This tutorial describes how to calculate basic statistics for spherical orientation data using the structr package. It covers the calculation of mean orientations, dispersion measures, hypothesis testing, orientation tensors, and clustering of orientation data.
Load the package:
To start, we import some example planes and lines, and convert them to spherical objects:
Mean and Dispersion
Arithmetic mean, geodesic mean, and projected mean
Arithmetic Mean and Variance
The arithmetic mean orientation of spherical data is calculated by summing up all orientation vectors and normalizing the resulting vector1:
This involves the resultant vector of a set of unit vectors , given by , and the resultant length .
The mean direction is the resultant vector normalized by its length while the mean resultant length (between 0 and 1) measures how tightly the vectors cluster around it.
In geology, these statistical estimators are useful for vectorial data ("Ray" objects) such as paleomagnetic directions or slip directions, but less so for axial data ("Line" objects) such as lineations or fold axes, where the sense along the line is not relevant2.
These estimators are good descriptors of the concentration of the data around the mean direction, assuming a unimodal, rotationally symmetric distribution such as the von Mises-Fisher distribution.
Define some weights for our lines based on the quality reported for the measurements:
The (weighted) arithmetic mean orientation of spherical data is:
lines_mean <- sph_mean(lines, w = line_weightings)… and the (weighted) arithmetic variance
lines_variance <- sph_var(lines, w = line_weightings)the (weighted) standard deviation (i.e. the 63% cone around the mean) and the 95% confidence cone around the mean:
lines_delta <- delta(lines, w = line_weightings)
lines_confangle <- sph_confidence_angle(lines, w = line_weightings)
Taken together, this prints as
c(
  "Variance" = lines_variance,
  "63% cone" = lines_delta,
  "Confidence angle" = lines_confangle
)
#>         Variance         63% cone Confidence angle
#>        0.1568745       32.5283448        6.6748765
Summary stats can also be retrieved through
summary(lines)
#>         azimuth          plunge        variance        68% cone confidence cone
#>      68.5127690      20.4958671       0.2168518      38.4502642       4.7492331
Plotting a summary of the stats on an equal-area projection:
stereoplot(center = lines_mean)
points(lines, col = "lightgrey", pch = 1, cex = .5)
points(lines_mean, col = "#B63679", pch = 19, cex = 1)
lines(lines_mean, ang = lines_confangle, col = "#E65164FF")
lines(lines_mean, ang = lines_delta, col = "#FB8861FF")
legend("topright", legend = c("Mean line", "95% confidence cone", "63% data cone"), col = c("#B63679", "#E65164FF", "#FB8861FF"), pch = c(19, NA, NA), lty = c(NA, 1, 1), cex = .75)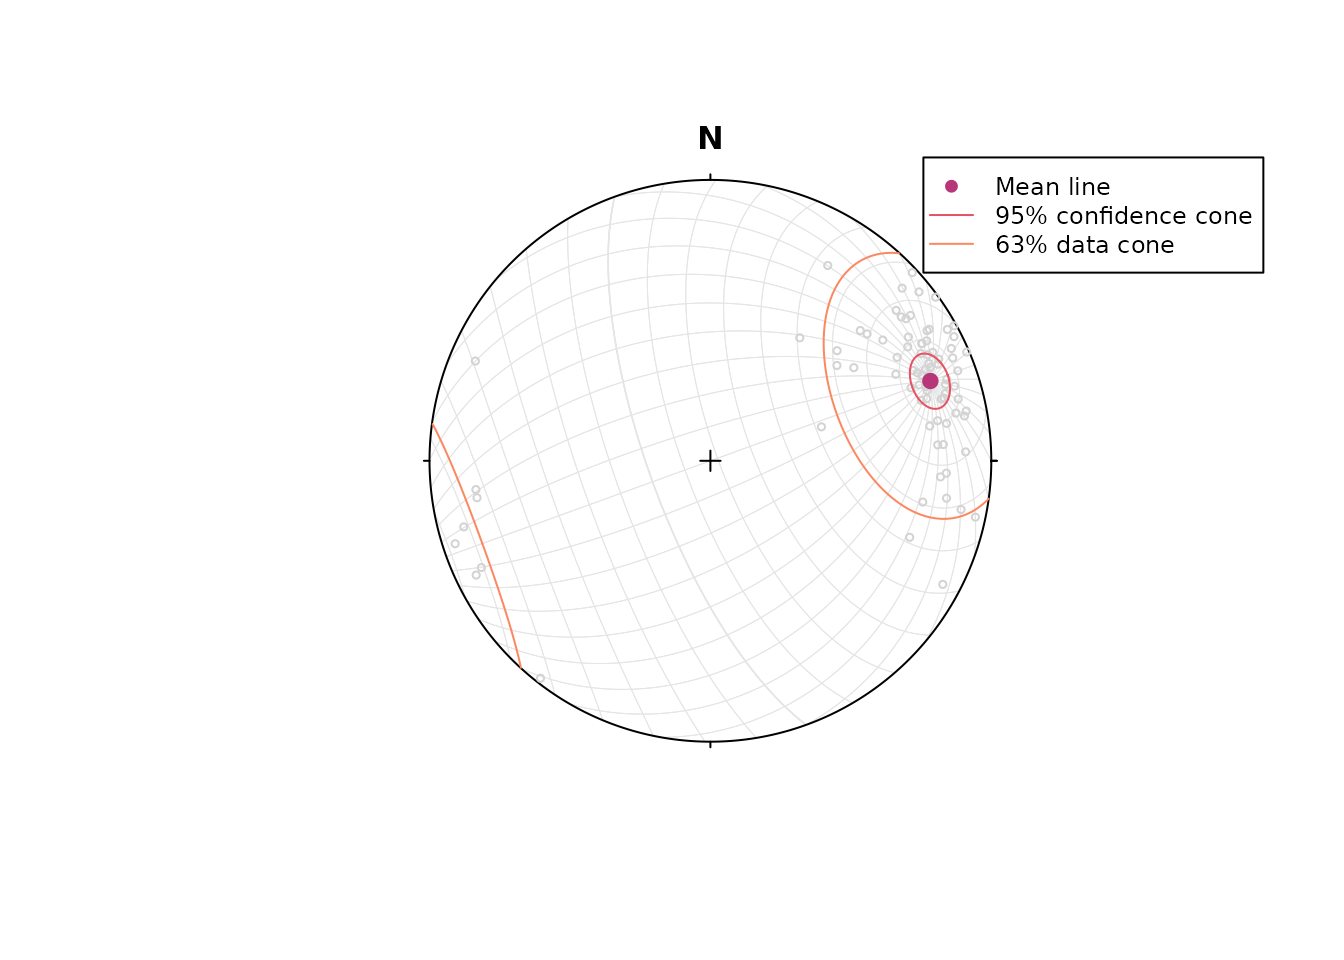
Orientation Tensor
Eigenvectors
The orientation tensor3 is the mean of the outer products of the orientation vectors with themselves, i.e. a symmetric matrix of the averaged products of their direction cosines, . In case of a Bingham distribution, the Eigenvectors of this tensor describe the orientation of the most dense, intermediate and least dense orientation, and thus, are used to determine the orientation of girdle-distributed vectors (e.g. folded planes).
The orientation tensor is calculated by ortensor():
ortensor(planes)
#> Orientation tensor
#>            [,1]        [,2]        [,3]
#> [1,]  0.5634412 -0.11043381 -0.12507927
#> [2,] -0.1104338  0.13269479 -0.04040902
#> [3,] -0.1250793 -0.04040902  0.30386403
The Eigenvalues and Eigenvectors of the orientation tensor can be computed through ot_eigen():
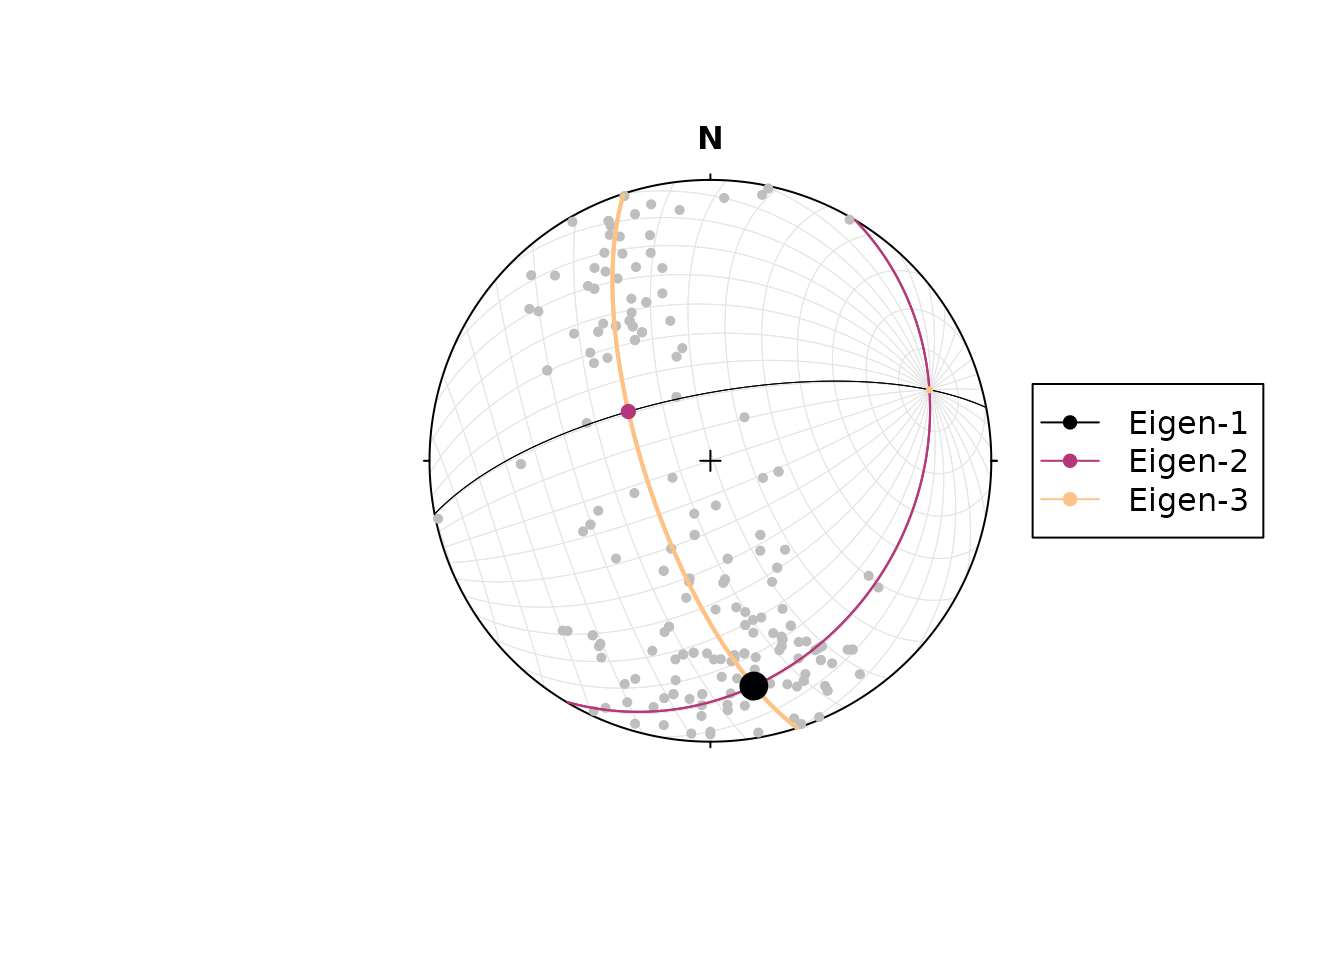
To visualize the orientation of the Eigenvectors and their -values, you can call the vectors and values of the object returned by ot_eigen():
stereoplot(center = planes_eigen$vectors[3, ])
points(example_planes, col = "grey", pch = 16, cex = .7)
lines(planes_eigen$vectors,
  col = c("#000004", "#B63679FF", "#FEC287FF"),
  lwd = rev(assign_cex(planes_eigen$values, range = c(.5, 2)))
)
points(planes_eigen$vectors,
  col = c("#000004", "#B63679FF", "#FEC287FF"),
  cex = assign_cex(planes_eigen$values, range = c(.5, 2)),
  pch = 16
)
legend("right",
  legend = c("Eigen-1", "Eigen-2", "Eigen-3"),
  col = c("#000004", "#B63679FF", "#FEC287FF"), pch = 16, lty = 1
)
Shape Parameters
There are more shape parameters using different algorithms based on the orientation tensor:
shape_params(planes)
#> $stretch_ratios
#>      Rxy      Ryz      Rxz
#> 1.478428 1.873104 2.769250
#>
#> $strain_ratios
#>       e12       e13       e23
#> 0.3909795 1.0185765 0.6275970
#>
#> $Flinn
#> $Flinn$k
#> [1] 0.5479625
#>
#> $Flinn$d
#> [1] 0.9955924
#>
#>
#> $Ramsay
#> intensity  symmetry
#> 0.5467429 0.6229787
#>
#> $Woodcock
#>  strength     shape
#> 1.0185765 0.6229787
#>
#> $Watterson_intensity
#> [1] 2.351532
#>
#> $Lisle_intensity
#> [1] 1.147654
#>
#> $Nadai
#>      goct      eoct
#> 0.8391109 0.7266914
#>
#> $Lode
#> [1] 0.2323021
#>
#> $kind
#> [1] "SSL"
#>
#> $MAD
#> [1] 32.80303
#>
#> $Jelinek
#> [1] 2.794622
Projected Mean
The Eigenvector with the largest Eigenvalue represents a vector parallel to the highest concentration of a population. This vector can also be described as the projected mean. A shortcut function for this is:
projected_mean(example_lines)
#> Line object (n = 1):
#>  azimuth   plunge
#> 69.09796 14.82125
Eigenvector-based estimators are good descriptors of the concentration of the data around the mean direction when the data is anisotropic and follows a unimodal, anisotropic distribution such as the Kent or Bingham distributions.
par(mfrow = c(1, 2))
stereoplot(center = sph_mean(example_lines))
points(example_lines, col = "grey", pch = 16, cex = .7)
points(sph_mean(example_lines), col = "#1D1147FF", pch = 16)
points(geodesic_mean(example_lines), col = "#B63679FF", pch = 16)
points(projected_mean(example_lines), col = "#FEC287FF", pch = 16)
title(main = "Lines")

legend("bottomleft",
  legend = c("Arithmetic mean", "Geodesic mean", "Projected mean"),
  col = c("#1D1147FF", "#B63679FF", "#FEC287FF"),
  pch = 16,
  bg = "white"
)

stereoplot(center = sph_mean(example_planes))
points(example_planes, col = "grey", pch = 16, cex = .7)
points(sph_mean(example_planes), col = "#1D1147FF", pch = 16)
points(geodesic_mean(example_planes), col = "#B63679FF", pch = 16)
points(projected_mean(example_planes), col = "#FEC287FF", pch = 16)
title(main = "Planes")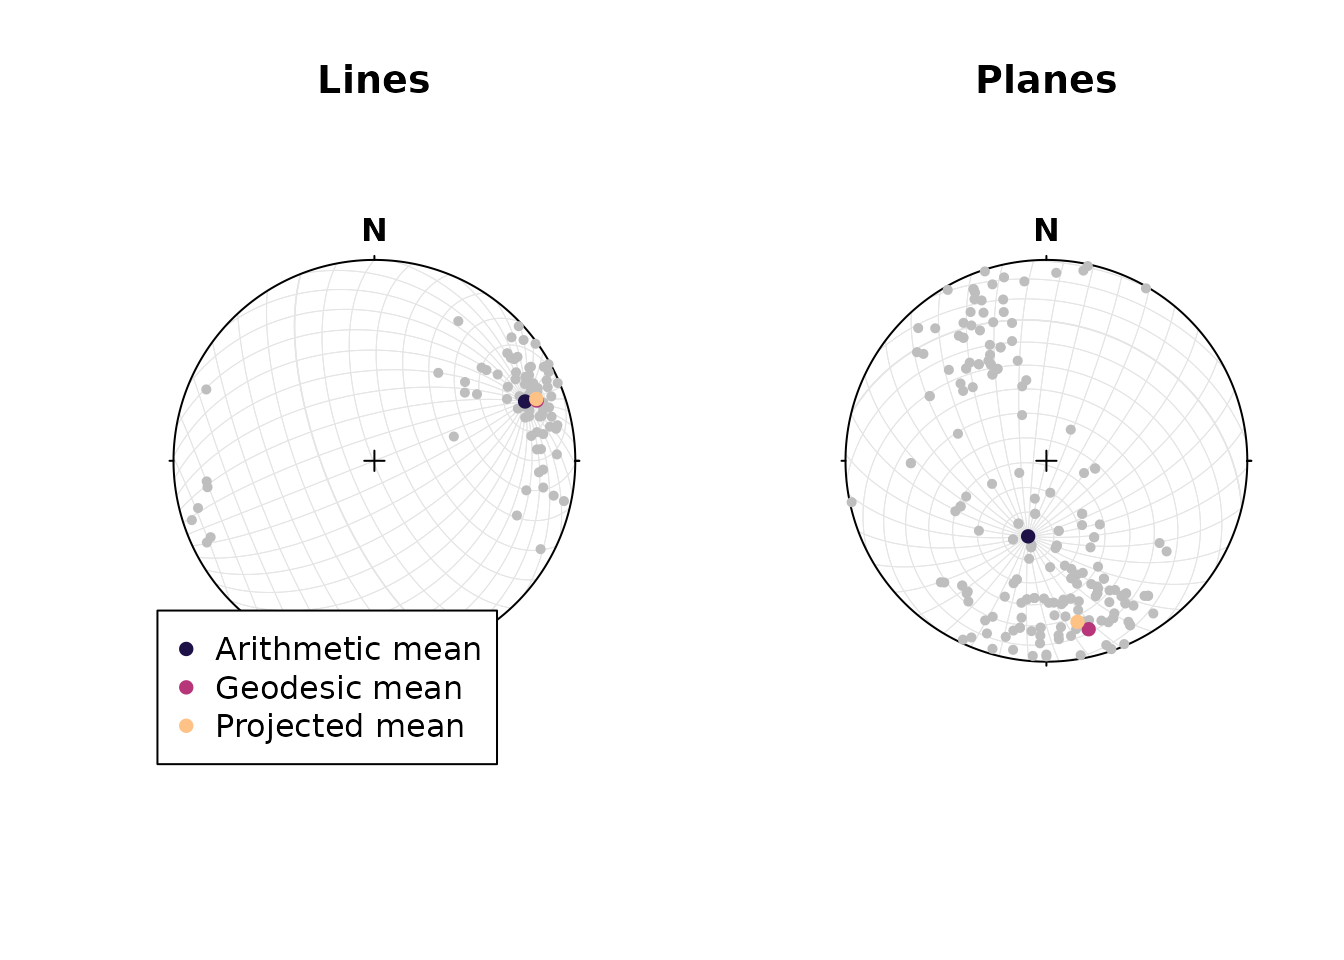
Geodesic Mean and Variance
Another measure of mean and dispersion is the Fréchet (geodesic L2) mean and variance, which is based on the angles between all data vectors4.
This can be visualized using the variance_plot(); here showing the (geodesic) angle distances between all lines and the first line in the same data set:
variance_plot(lines, Line(120, 50))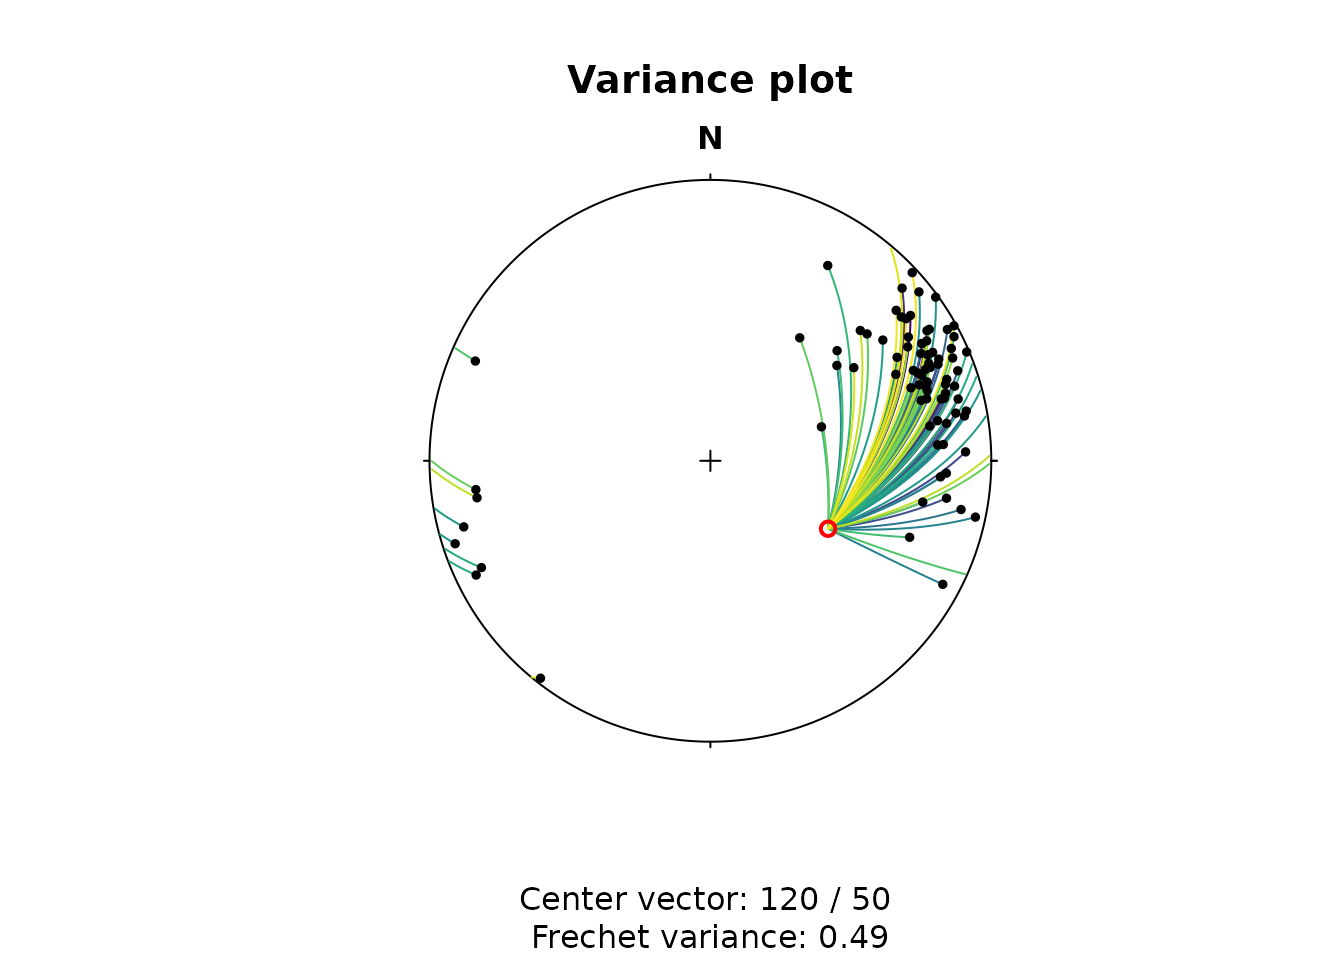
Note
The Fréchet mean is the vector that minimizes the sum of the squared angle distances to all data vectors. The Fréchet variance about this mean is the sum of the squared angle distances between all data vectors and the Fréchet mean.
To find the Fréchet mean vector, the algorithm iteratively searches for the vector by using a numerical optimization method to minimize the distances to all other vectors:
# Mean
geodesic_mean(lines)
#> Line object (n = 1):
#>  azimuth   plunge
#> 69.64260 14.87822

# Variance
geodesic_var(lines)
#> [1] 0.06118261
Fréchet variance based metrics are good estimators when the population’s distribution is complex or unknown.
Maximum Likelihood Estimation of Distribution Parameters
MLE of distribution parameters (center, dispersion) are implemented for von Mises-Fisher, Watson, Bingham, and Kent distributions:
par(mfrow = c(2, 2), mar = c(2, 2, 1, 1))
x1 <- rvmf(100, mu = Ray(120, 50), k = 5)
r1 <- fisher_MLE(x1)
plot(x1, col = "grey")
points(r1$muHat, col = "red")
title(main = "von Mises-Fisher")

x2 <- rwatson(100, mu = Line(120, 50), k = 5)
r2 <- watson_MLE(x2)
plot(x2, col = "grey")
points(r2$muHat, col = "red")
title(main = "Watson")

x3 <- rkent(100, mu = Ray(120, 50), k = 5, b = 1)
r3 <- kent_MLE(x3)
plot(x3, col = "grey")
points(r3$G, col = "red")
title(main = "Kent")

a <- cov(iris[, 1:3])
x4 <- rbingham(100, a, "Line")
r4 <- bingham_MLE(x4)
plot(x4, col = "grey")
points(r4$vectors, col = "red")
title(main = "Bingham")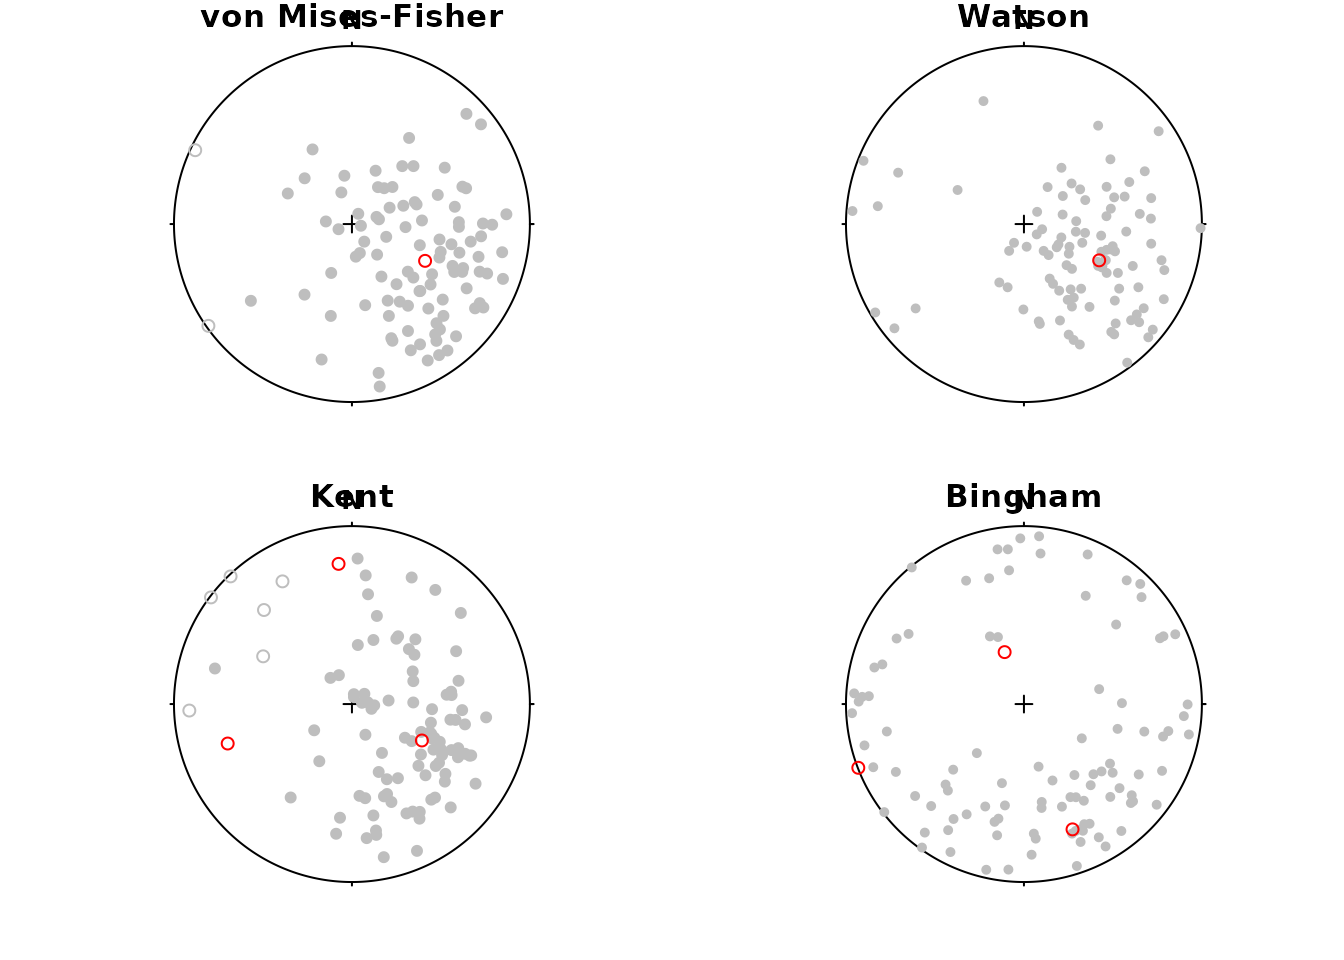
Hypothesis Testing
To test if a line represents the population mean of a given set of lineations, we need to calculate the confidence region of our population.
Let’s test the hypothesis that a lineation trending 002° and plunging 10° is the mean for our lineations.
line_NULL <- Line(2, 10)Parametric Testing
Parametric testing means that we assume a specific underlying distribution of the data. Here, we assume that the lineations are drawn from a von Mises-Fisher distribution.
Confidence Region
cep <- fisher_inference(lines, alpha = 0.05)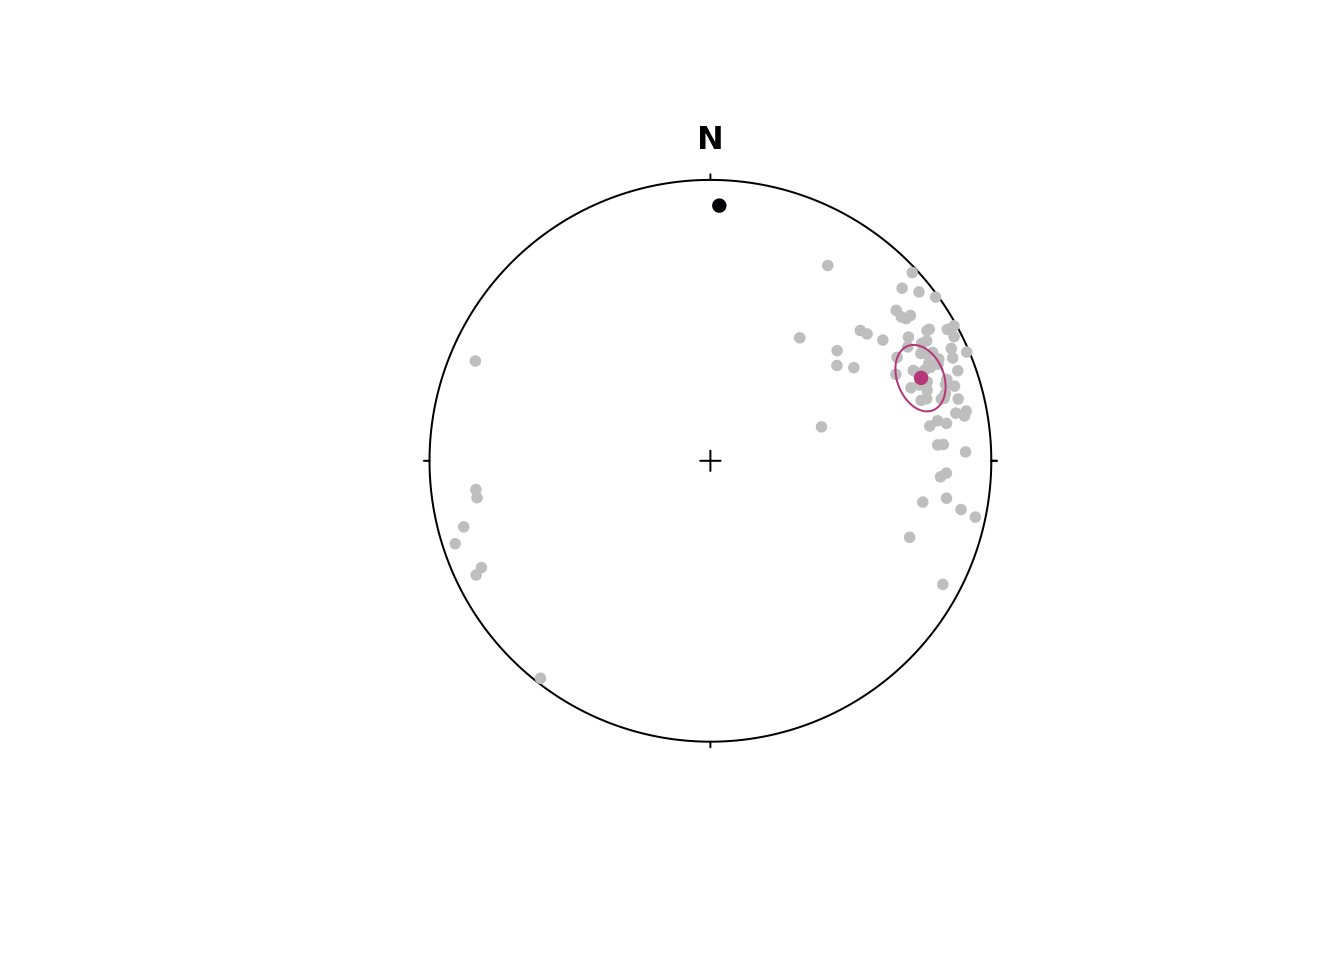
Non-parametric Testing
Non-parametric testing does not require assumptions on the distribution of the data. This is commonly achieved using bootstrapping and permutation techniques.
Confidence Region
The 95% confidence interval (from 10,000 bootstrap samples):
cenp <- confidence_ellipse(lines, n = 10000, alpha = 0.05)To visualize the confidence region of our lines:
plot(lines, col = "grey")
stereo_confidence(cenp, col = "#B63679FF")
points(line_NULL, col = "#000004", pch = 16)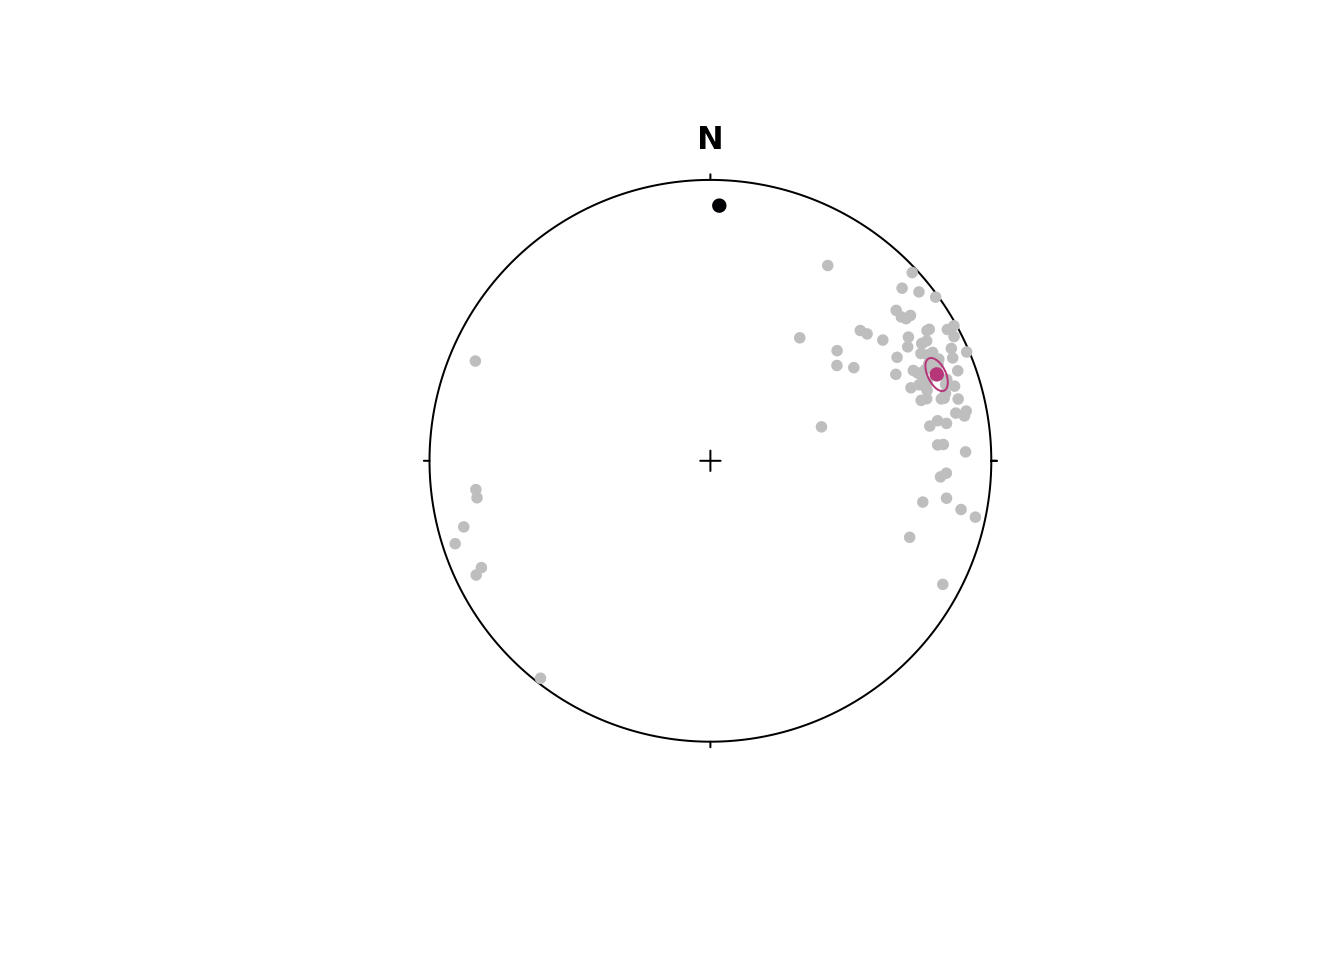
The -value for our hypothesis line:
cenp$pvalue.FUN(line_NULL)
#> [1] 0
As the -value is smaller than 0.05, we reject the null hypothesis that the given line represents the population mean at the 5% significance level.
Two-Sample Permutation Test
Wellner’s Rayleigh-style T-statistic5 measures how different two sets of vectors are. The test statistic T is a non-negative measure of dissimilarity between two datasets. The value is zero when the datasets are identical.
wellner(lines, line_NULL, n_perm = 1000)
#>
#>  Wellner permutation test
#>
#> statistic = 10.251, p-value = 0.008991
#> critical value (95% confidence level) = 5.5017
#> null hypothesis rejected at the 95% confidence level: yes
#> further statistics:
#>       n_perm   df_uniform    p_uniform
#> 1.000000e+03 5.000000e+00 6.843564e-02
#> source: Wellner (1979), Ann. Statist. 7, 929-943
A -value for this test statistic is estimated using permutations. The fraction of permutations in which the computed T-statistic exceeds the observed T for the original data (a number between 0 and 1 inclusive) can be interpreted as a -value for the null hypothesis that the two populations are identical (not merely that their means coincide). Thus, smaller -values indicate stronger evidence that the two populations differ significantly.
Other tests
Additionally, the following tests are currently implemented in {structr}:
Rayleigh test of uniformity against a unimodal alternative:
rayleigh_test3()Bingham test of uniformity of axes on the sphere:
bingham_test()Fisher’s F-Test for Mean Orientations:
fisher_ftest()Goodness-of-fit tests of the Fisher distribution:
fisher_goodness_of_fit()Score test of the Fisher against the Kent distribution:
fisher_kent_test()Watson’s Test of rotational symmetry of a Bingham distribution:
watson_symmetry_test()
Cluster Vectors
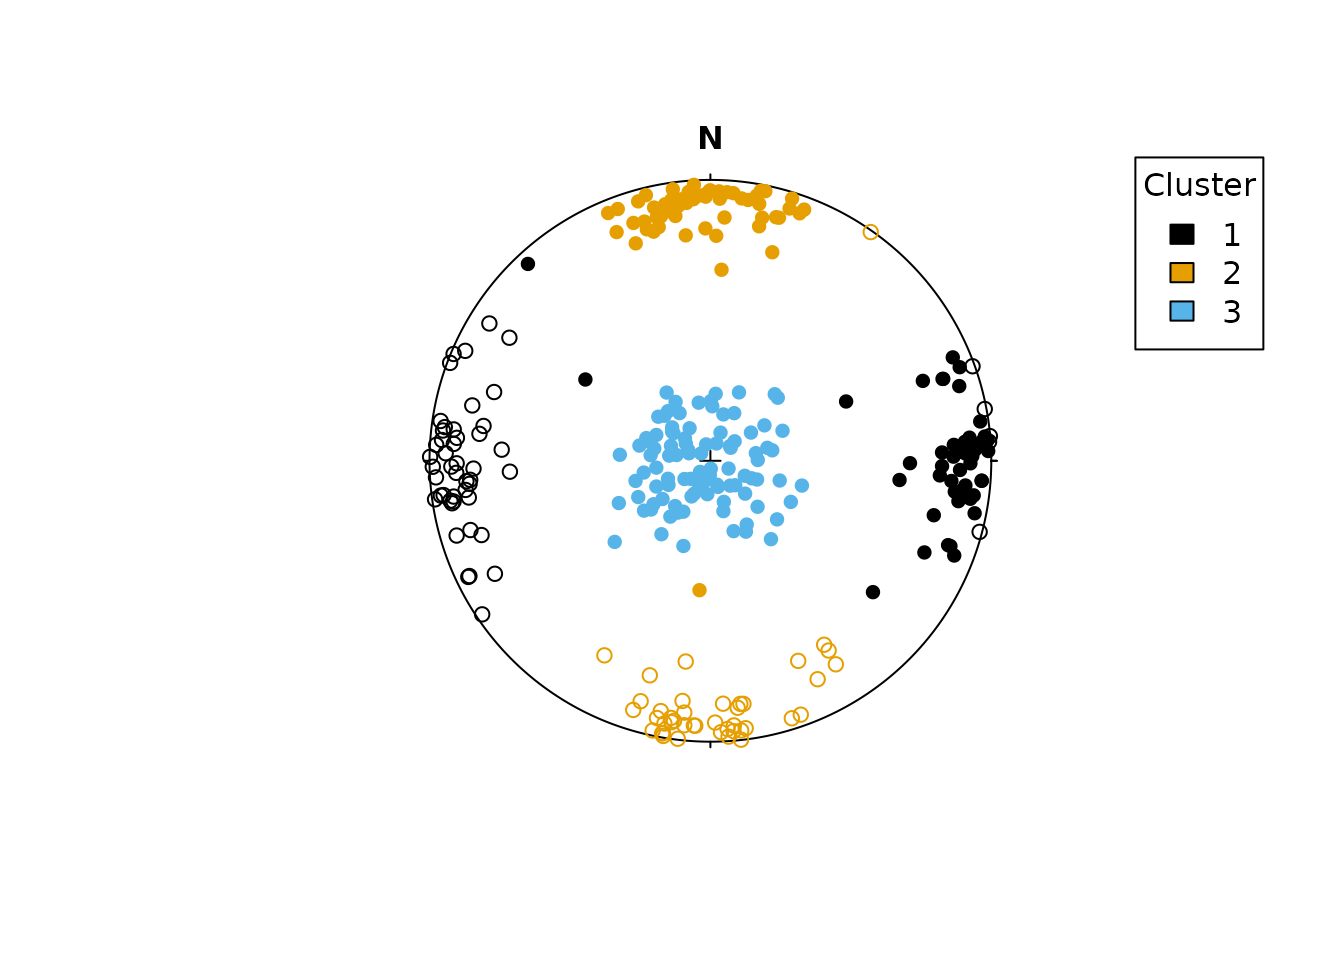
To find k clusters of orientational data, the sph_cluster() function can be used:
# generate some random vectors:
x1 <- rvmf(100, mu = Ray(90, 0), k = 20)
x2 <- rvmf(100, mu = Ray(0, 0), k = 20)
x3 <- rvmf(100, mu = Ray(0, 90), k = 20)
x123 <- rbind(x1, x2, x3)

# cluster the vectors:
cl <- sph_cluster(x123, k = 3)

# visualize the result:
plot(x123, col = assign_col_d(cl$cluster))

legend_col_d(assign_col_d(unique(cl$cluster)), title = "Cluster")