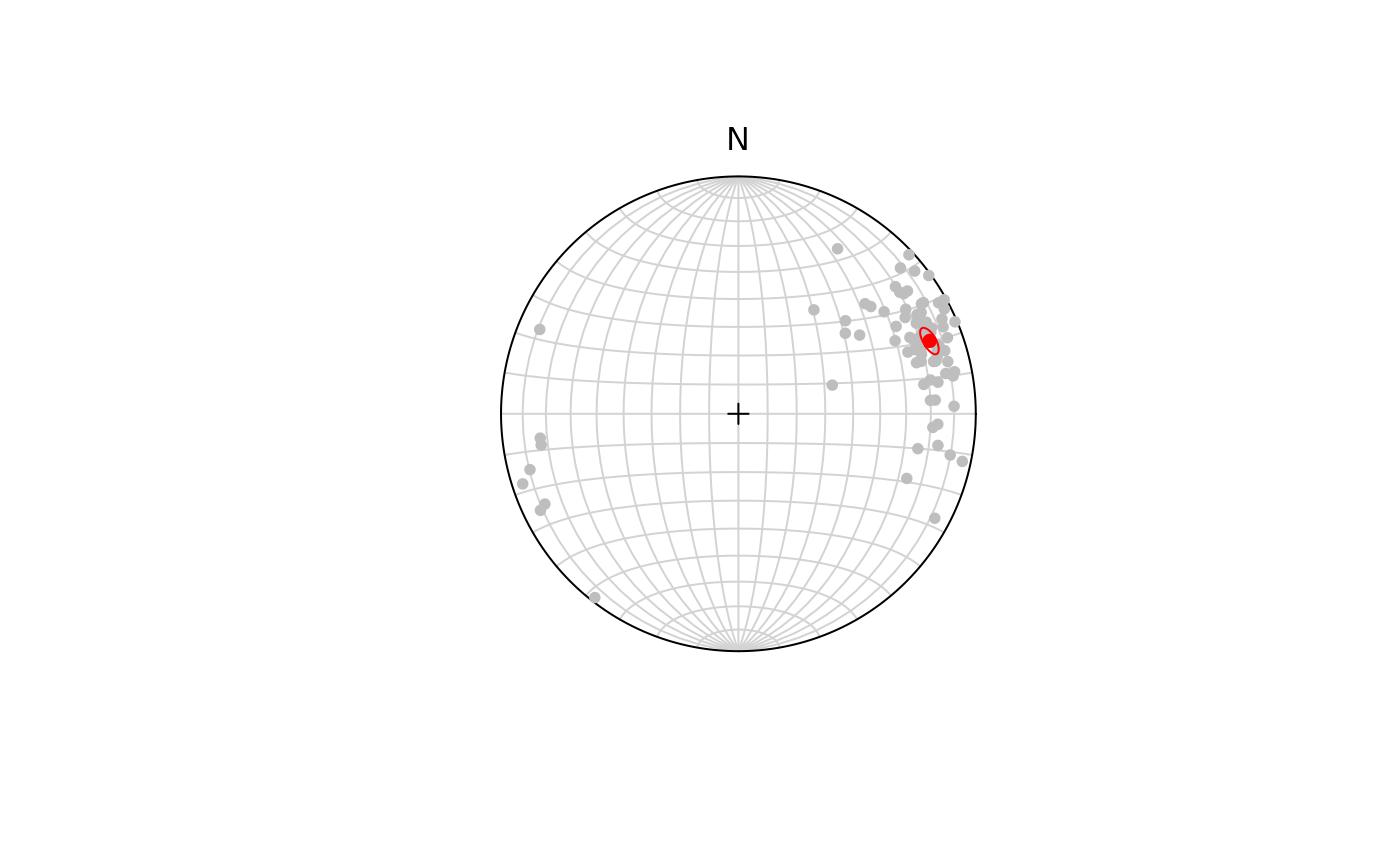
Adds an ellipse marking the bootstrapped confidence interval of the arithmetic mean to an existing plot
Arguments
- x
Spherical object or a list containing the output of an earlier call of
confidence_ellipse()- params
list. Parameters passed to
confidence_ellipse()- .center
logical. Whether the ellipse's center should be plotted?
- col
Color of the ellipse and its center
- pch, cex
Plotting symbol and size of the ellipse center. Ignored if
.centerisFALSE.- upper.hem
logical. Whether the projection is shown for upper hemisphere (
TRUE) or lower hemisphere (FALSE, the default).- earea
logical
TRUEfor Lambert equal-area projection (also "Schmidt net"; the default), orFALSEfor meridional stereographic projection (also "Wulff net" or "Stereonet").- BALL.radius
numeric size of sphere
- ...
graphical parameters passed to
graphics::lines()
Value
output of confidence_ellipse()