Initialize the plot for equal-angle stereographic projections (Wulff) or Lambert equal-area projections (Schmidt).
Usage
stereoplot(
  earea = NULL,
  guides = NULL,
  d = NULL,
  col = NULL,
  lwd = NULL,
  lty = NULL,
  border.col = NULL,
  title = NULL,
  sub = NULL,
  origin.text = NULL,
  labels = NULL,
  ladj = NULL,
  centercross = NULL,
  ticks = NULL,
  radius = NULL,
  center = NULL
)Arguments
- earea
logical. Projection, either
TRUEfor Lambert equal-area projection, orFALSEfor meridional stereographic projection. Defaults togetOption("structr.earea").- guides
logical. Whether guides should be added to the plot. Defaults to
getOption("structr.guides").- d
integer. Angle distance between guides. Defaults to
getOption("structr.d").- col
Color of guide lines. Defaults to
getOption("structr.col").- lwd
Width of guide lines. Defaults to
getOption("structr.lwd").- lty
Type of guide lines. Defaults to
getOption("structr.lty").- border.col
color of primitive circle (frame), center-cross and ticks of the stereo plot. Defaults to
getOption("structr.border.col").- title, sub
character. Title and subtitle of plot
- origin.text
character. Text at origin of plot. Defaults to
getOption("structr.origin.text").- labels
this can either be a logical value specifying whether (numerical) annotations are to be made next to the tick marks, or a character or expression vector of labels to be placed next to the tick points. Defaults to
getOption("structr.labels").- ladj
adjustment for all labels away from origin of projection circle. This essentially an amount that is added to
radiusand the length of the ticks. Defaults togetOption("structr.ladj").- centercross
logical. Whether a center cross should be added (
TRUEby default). Defaults togetOption("structr.centercross").- ticks
integer. Angle between ticks. if
NULL(the default), no ticks are drawn. Defaults togetOption("structr.ticks").- radius
numeric. Radius of circle. Defaults to
getOption("structr.radius").- center
An object of class
"Vec3","Line","Ray", or"Plane"specifying the center of the projection IfNULL(the default), the center is at the origin of the plot.
Examples
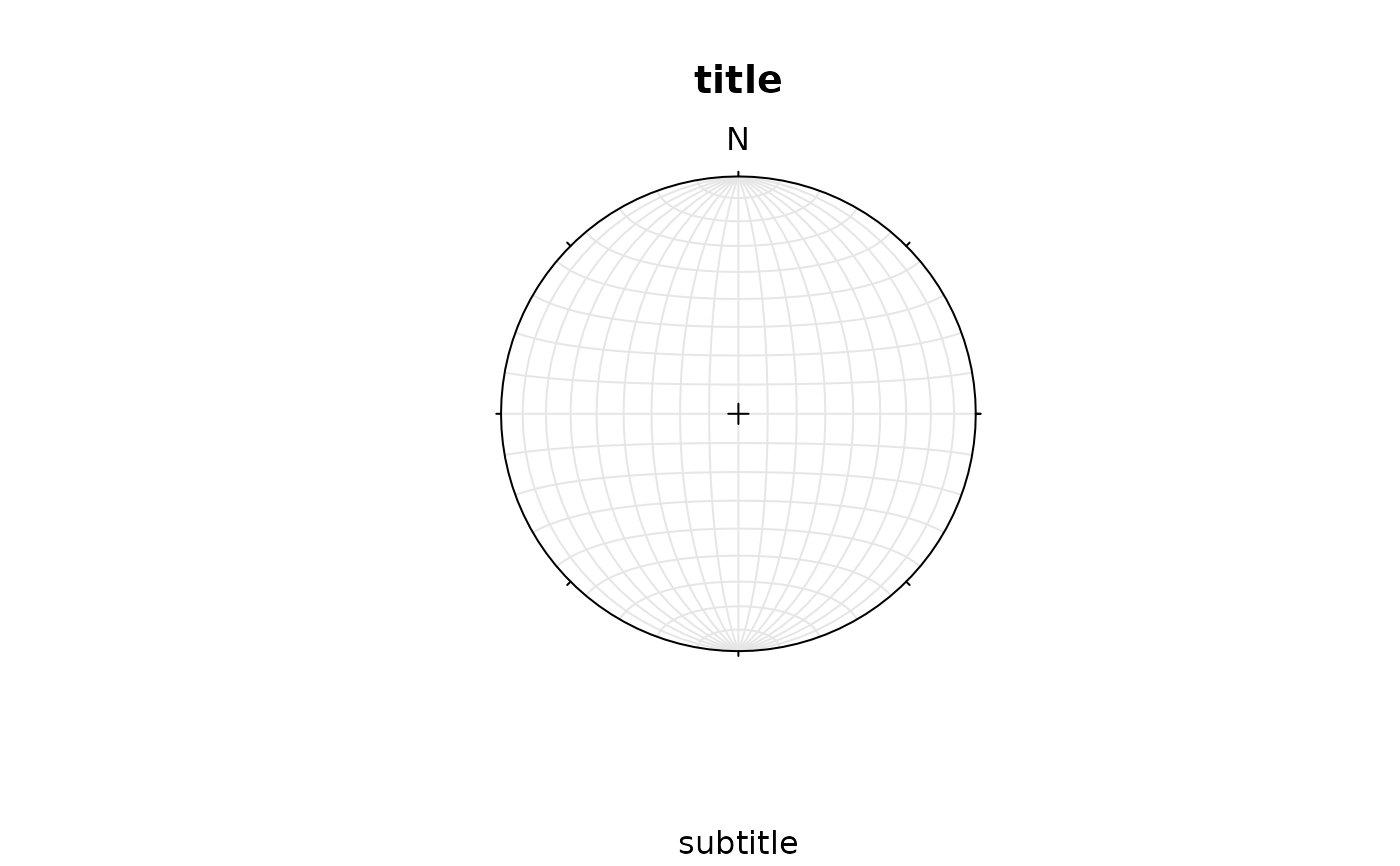
stereoplot()
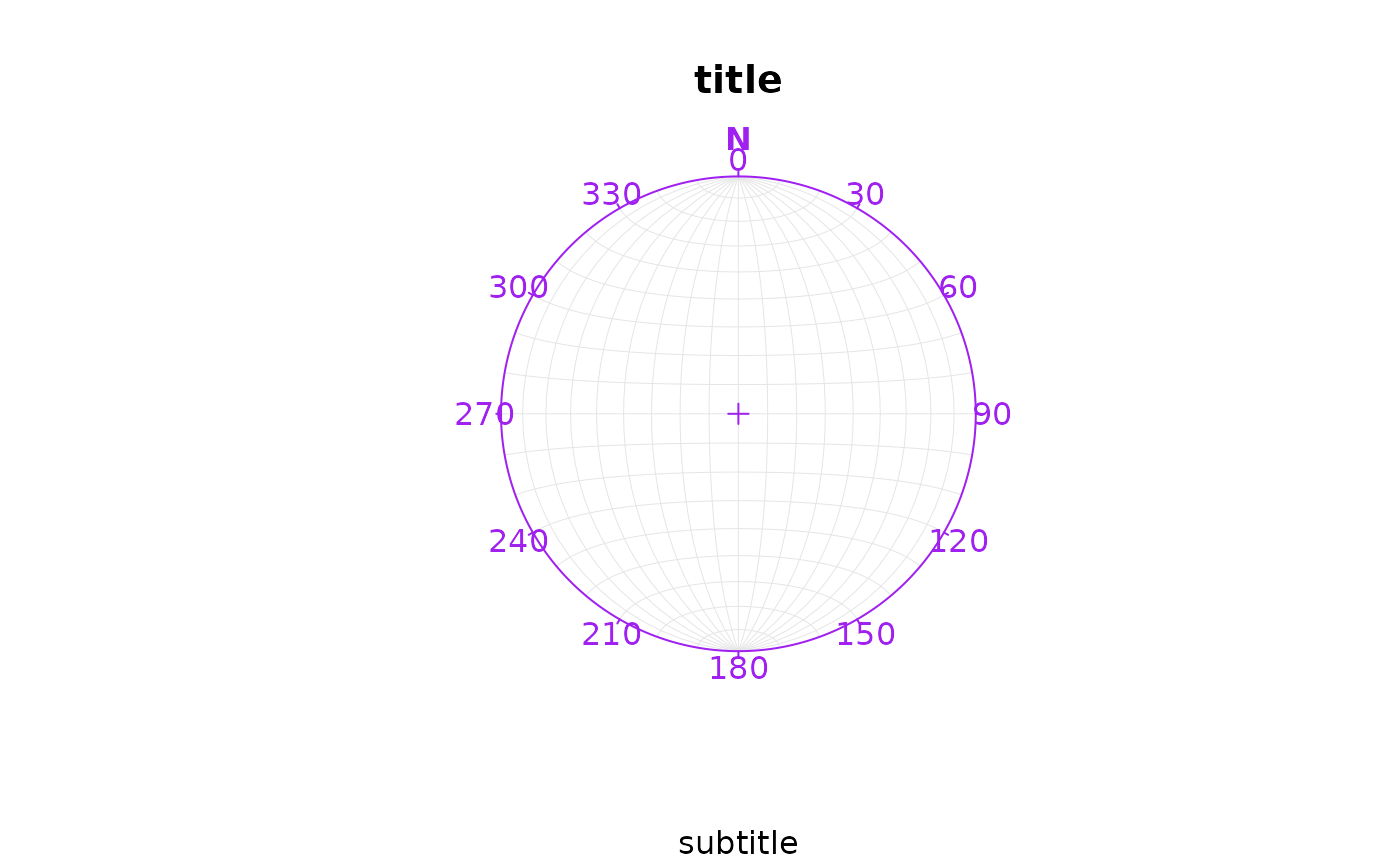
 stereoplot(ticks = 30, title = "title", sub = "subtitle", border.col = "purple", labels = TRUE)
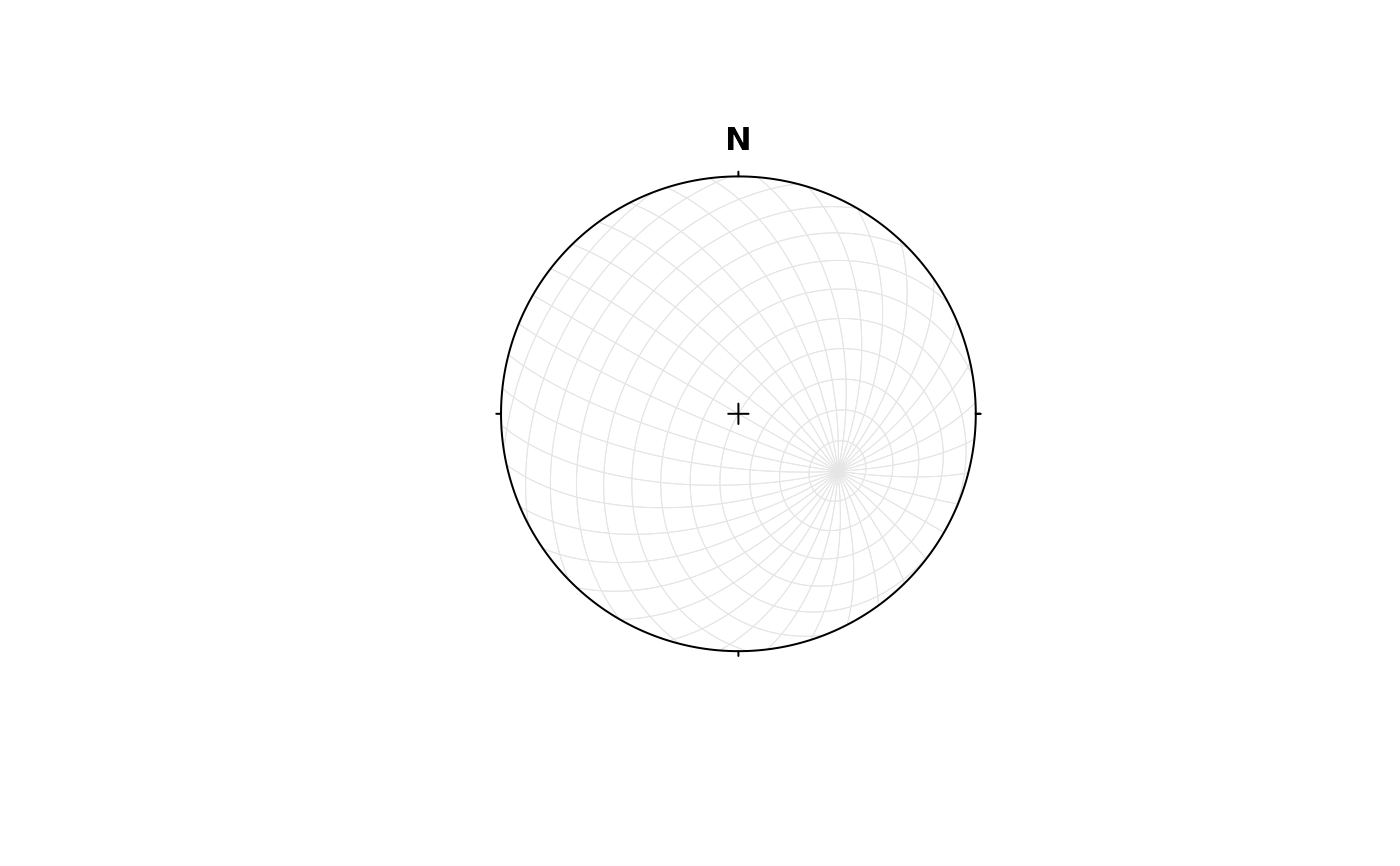
 stereoplot(center = Line(120, 50))