This tutorial demonstrates how to use the {structr} package to perform basic stress calculations and visualize the stress state using a Mohr circle.
Some basic calculations:
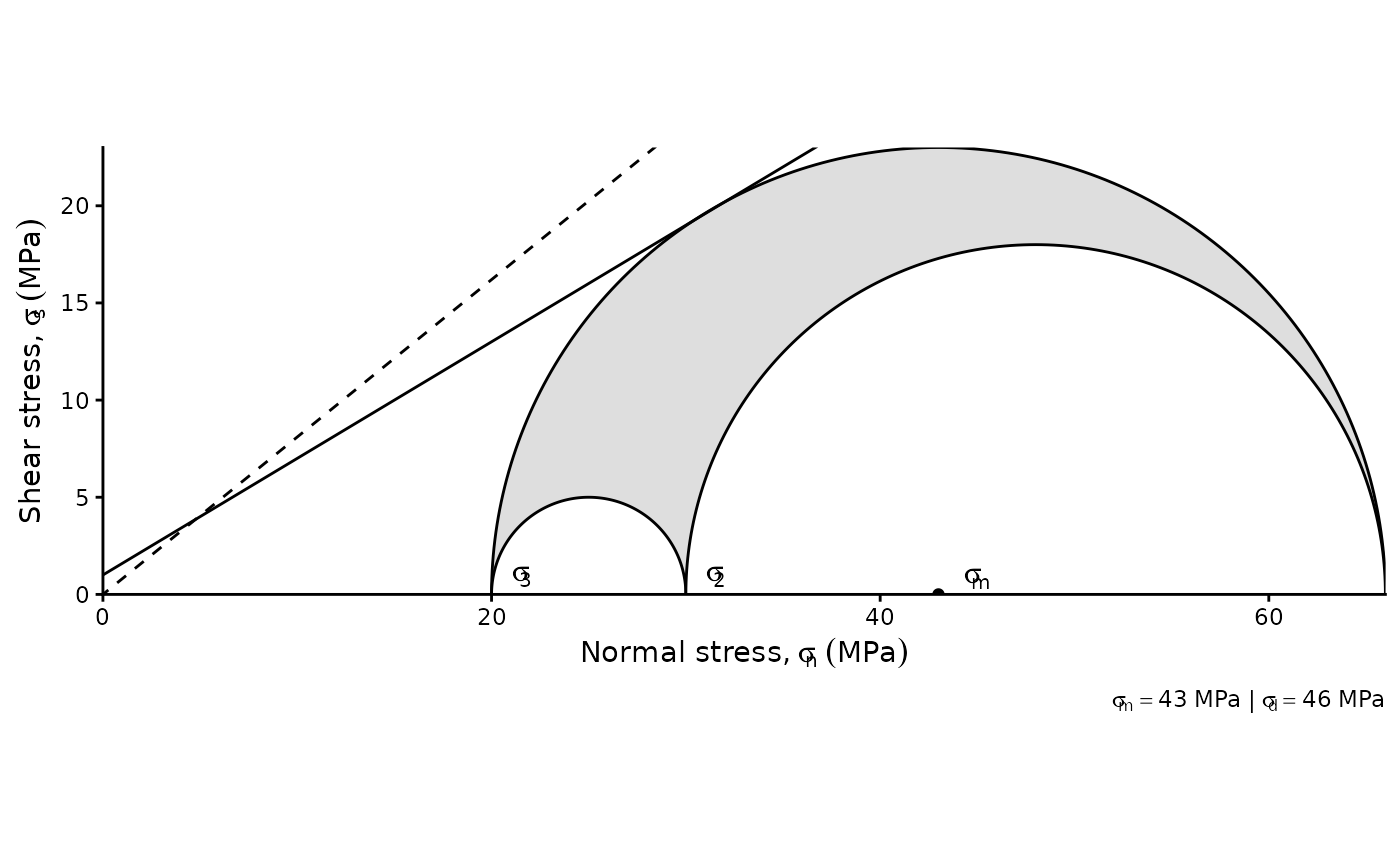
# Define the magnitudes of the principal stress axes
s1 <- 66 # maximum stress, sigma 1
s2 <- 30 # intermediate stress, sigma 2
s3 <- 20 # minimum stress, sigma 3

# Differential stress
diff_stress(s1, s3)
#> [1] 46

# Mean stress
mean_stress(s1, s3)
#> [1] 43

# Shear stress at given angle
shear_stress(s1, s3, theta = 35)
#> [1] 21.61293

# Normal stress at given angle
normal_stress(s1, s3, theta = 35)
#> [1] 35.13354

# Angle of fracture for given coefficient of internal friction
fracture_angle(mu = 0.6)
#> [1] 60.48188
To plot the Mohr circle, you can either use base R plotting:
Mohr_plot(
  sigma1 = s1, sigma2 = s2, sigma3 = s3,
  unit = "MPa", full.circle = TRUE,
  xlim = c(-1, 70), ylim = c(-30, 30)
)

# add the failure criterion
failure_criterion(col = "#B63679", lwd = 2)
or ggplot-style plotting:
ggMohr(sigma1 = s1, sigma2 = s2, sigma3 = s3, unit = "MPa") +

  # Only show upper half of MohR Circle
  coord_equal(ylim = c(0, NA), expand = FALSE) +

  # select plotting theme
  theme_classic()