Add Points to a Plot
Usage
# S3 method for class 'spherical'
points(x, upper.hem = NULL, earea = NULL, ...)
Arguments
- x
object of class
"Vec3","Line","Ray","Plane","Pair", or"Fault", where the rows are the observations and the columns are the coordinates.- upper.hem
logical. Whether the projection is shown for upper hemisphere (
TRUE) or lower hemisphere (FALSE). Defaults togetOption("structr.upper.hem").- earea
logical. Projection, either
TRUEfor Lambert equal-area projection, orFALSEfor meridional stereographic projection. Defaults togetOption("structr.earea").- ...
arguments passed to
graphics::points()
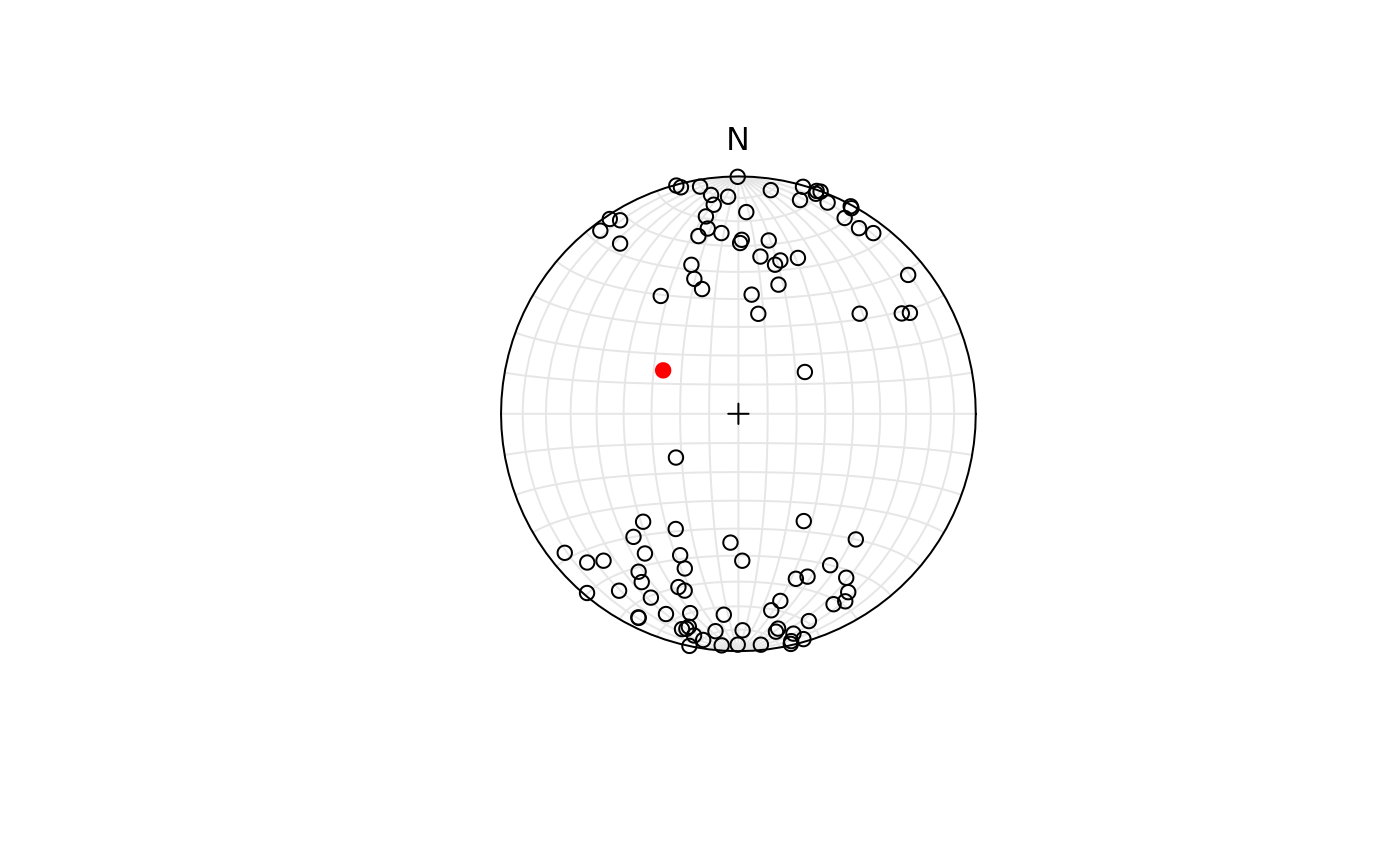
Examples
stereoplot()
points(rvmf(n = 100))
points(Plane(120, 30), col = "red", pch = 19)