Add Lines to a Plot
Usage
# S3 method for class 'spherical'
lines(x, ang = 90, ...)
Arguments
- x
object of class
"Vec3","Line","Ray","Plane","Pair", or"Fault", where the rows are the observations and the columns are the coordinates.- ang
numeric. Conical angle in degrees.
- ...
arguments passed to
graphics::lines()
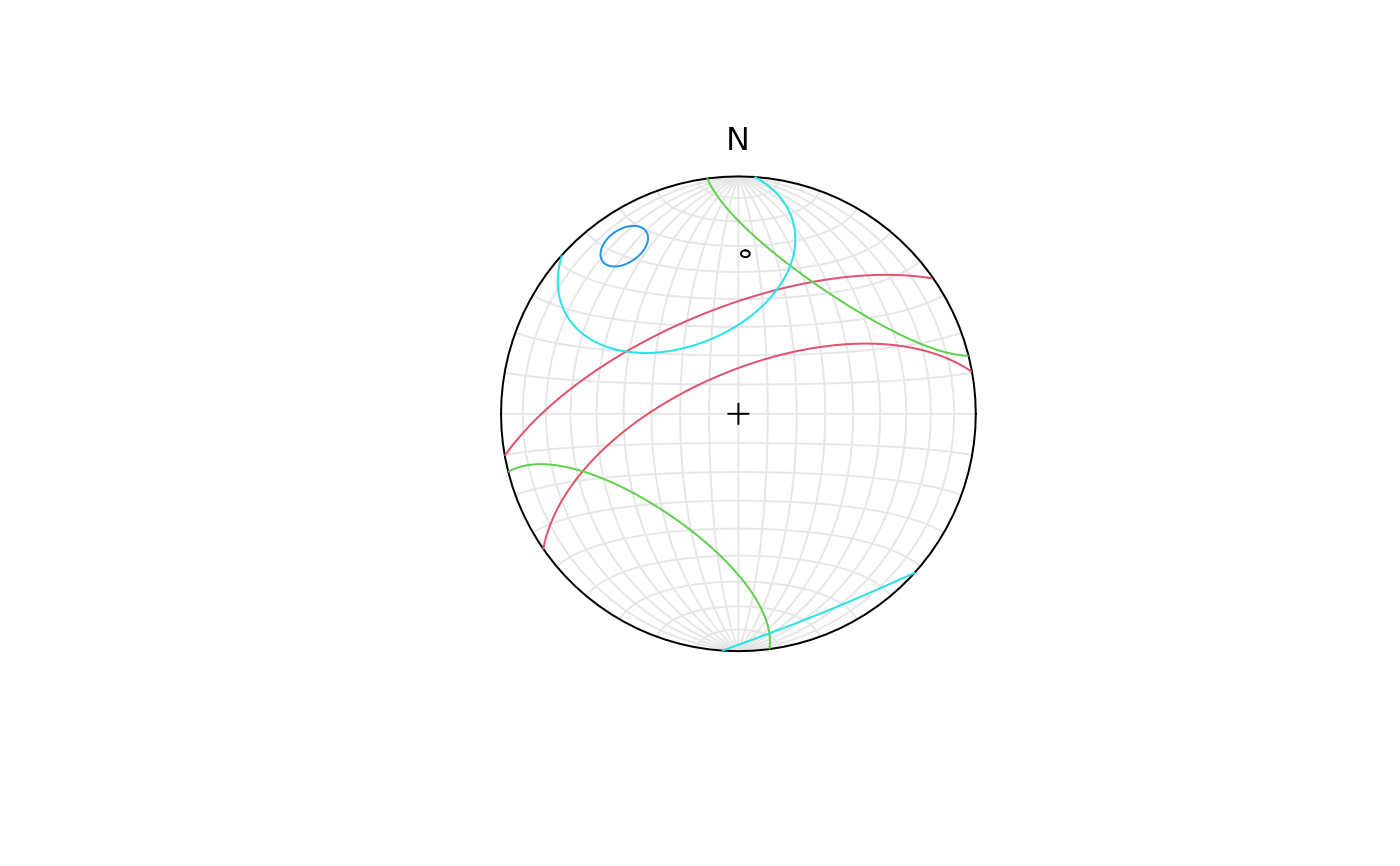
Examples
set.seed(20250411)
stereoplot()
lines(rvmf(n = 5), ang = runif(5, 0, 90), col = 1:5)