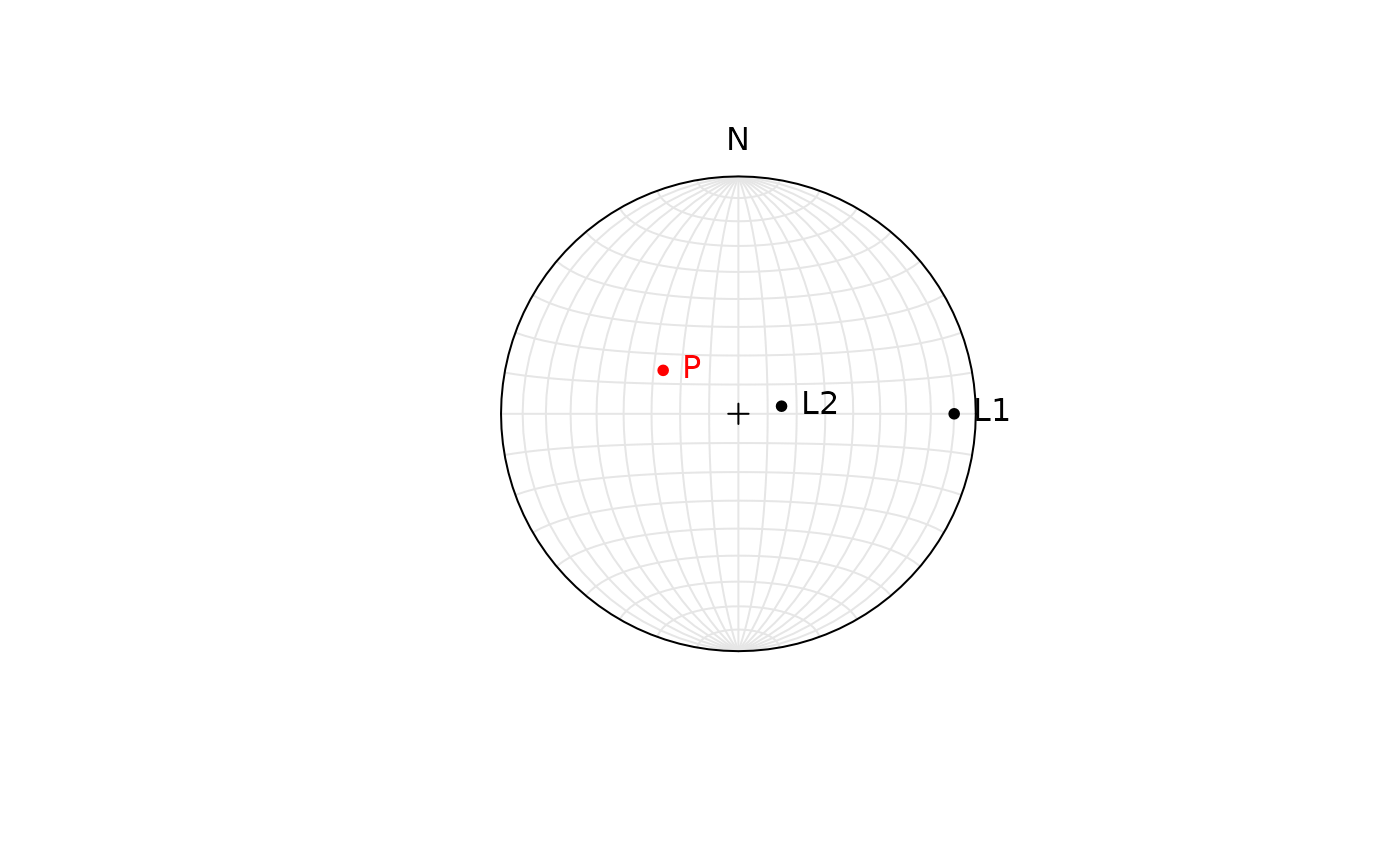
Visualization of lines, planes in a stereographic projection.
Usage
stereo_point(
  x,
  col = 1,
  pch = 20,
  lab = NULL,
  text.pos = 4,
  cex = 1,
  upper.hem = NULL,
  earea = NULL,
  ...
)
Arguments
- x
object of class
"Vec3","Line","Ray","Plane","Pair", or"Fault", where the rows are the observations and the columns are the coordinates.- col
color
- pch
plotting character
- lab
character. text labels
- text.pos
position for labels
- cex
character expansion of labels
- upper.hem
logical. Whether the projection is shown for upper hemisphere (
TRUE) or lower hemisphere (FALSE). Defaults togetOption("structr.upper.hem").- earea
logical. Projection, either
TRUEfor Lambert equal-area projection, orFALSEfor meridional stereographic projection. Defaults togetOption("structr.earea").- ...
optional graphical parameters