Adds equal-area or equal-angle projection gridlines to an existing stereoplot.
Arguments
- d
angle between grid lines
- earea
logical. Projection, either
TRUEfor Lambert equal-area projection, orFALSEfor meridional stereographic projection. Defaults togetOption("structr.earea").- radius
numeric. Radius of circle. Defaults to
getOption("structr.radius").- center
Center position of gridlines. If
NULL(the default), gridlines are centered on the origin of the stereoplot. Otherwise, this should is an spherical object.- ...
optional arguments passed to
graphics::lines()
Examples
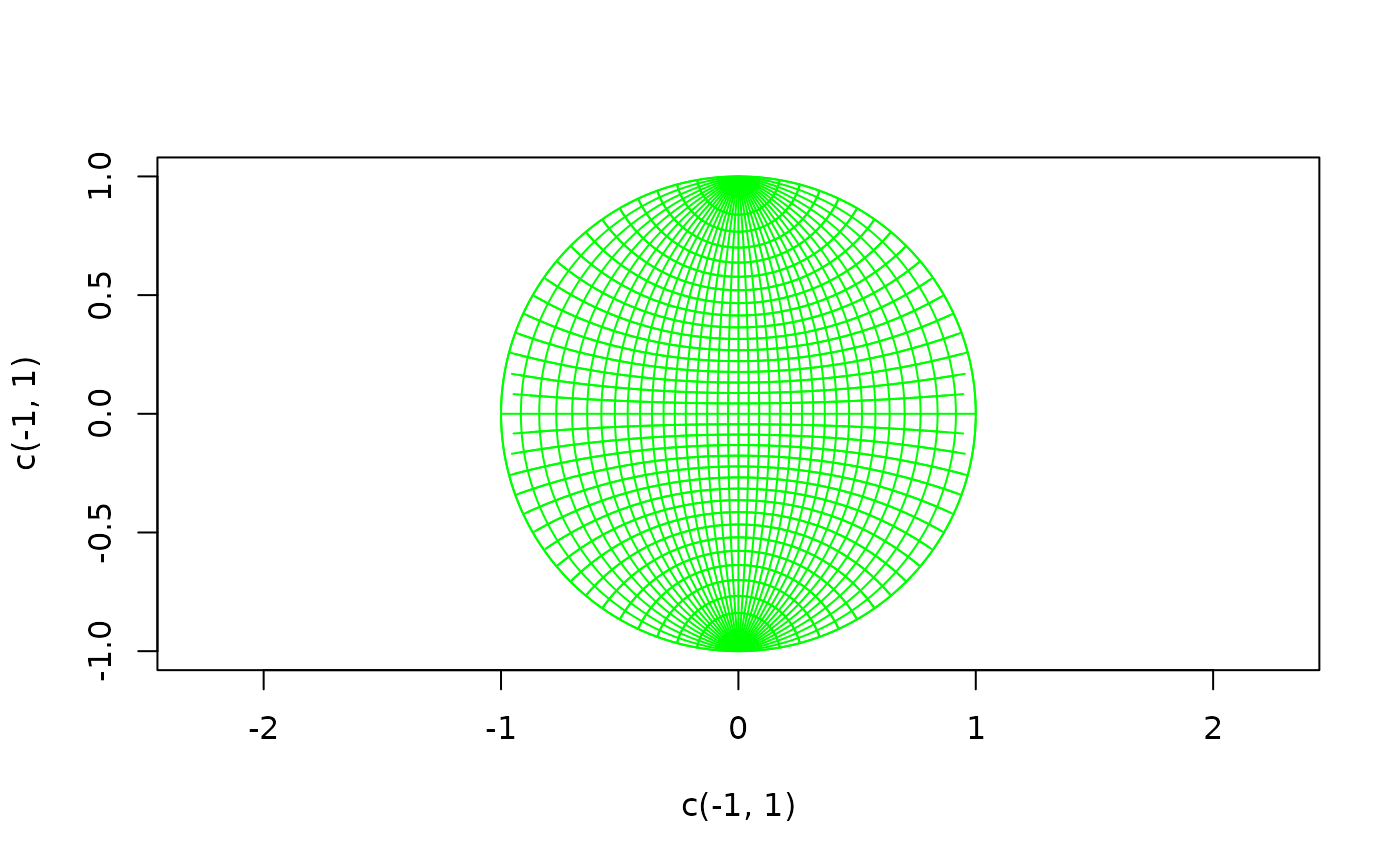
plot(c(-1, 1), c(-1, 1), type = "n", asp = 1)
stereoplot_guides(d = 5, earea = FALSE, col = "green", rotation = 20)
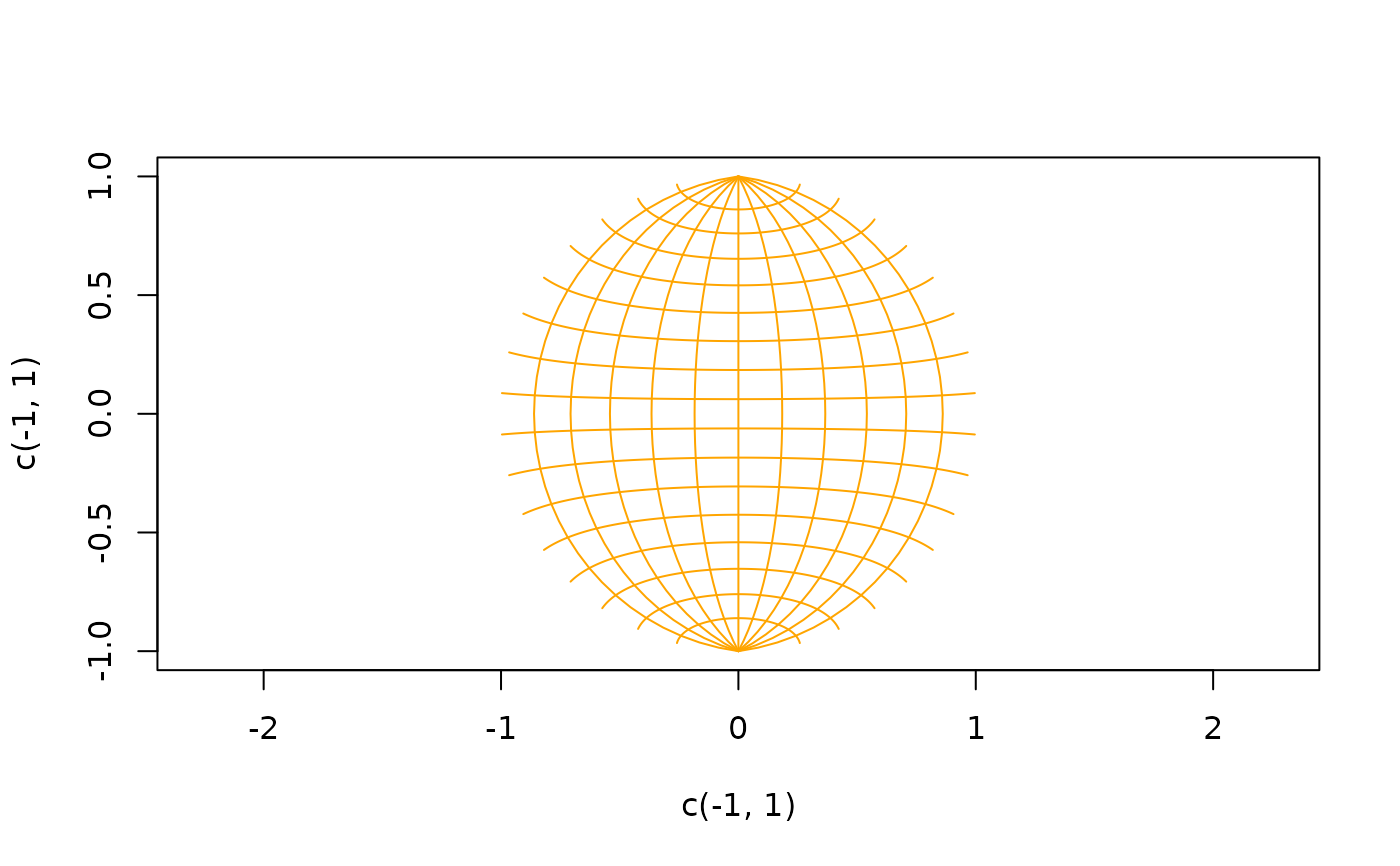
 plot(c(-1, 1), c(-1, 1), type = "n", asp = 1)
stereoplot_guides(d = 15, earea = TRUE, col = "orange", rotation = 90)
plot(c(-1, 1), c(-1, 1), type = "n", asp = 1)
stereoplot_guides(d = 15, earea = TRUE, col = "orange", rotation = 90)
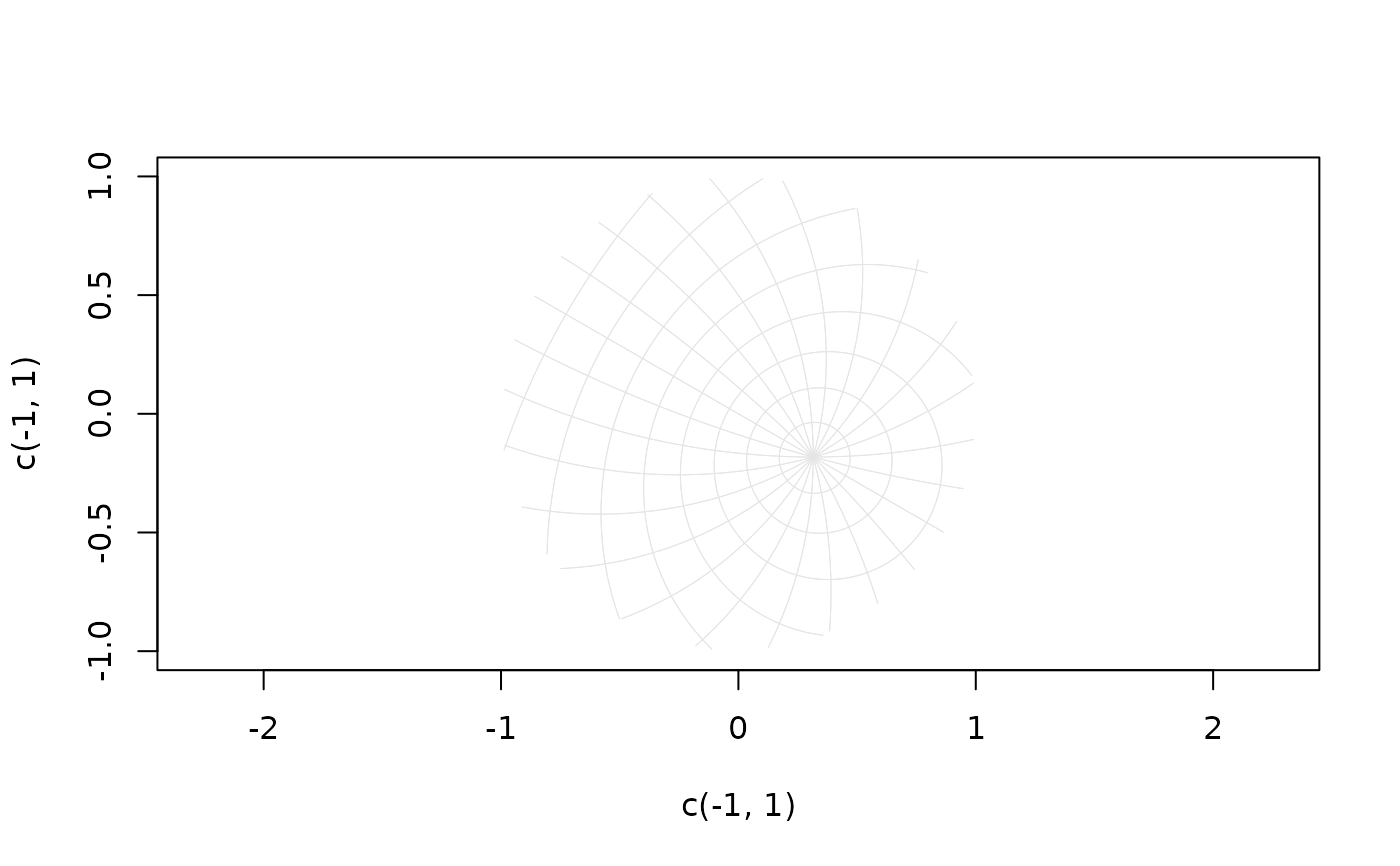
 plot(c(-1, 1), c(-1, 1), type = "n", asp = 1)
stereoplot_guides(d = 15, earea = FALSE, center = Line(120, 50), col = 'red')
plot(c(-1, 1), c(-1, 1), type = "n", asp = 1)
stereoplot_guides(d = 15, earea = FALSE, center = Line(120, 50), col = 'red')