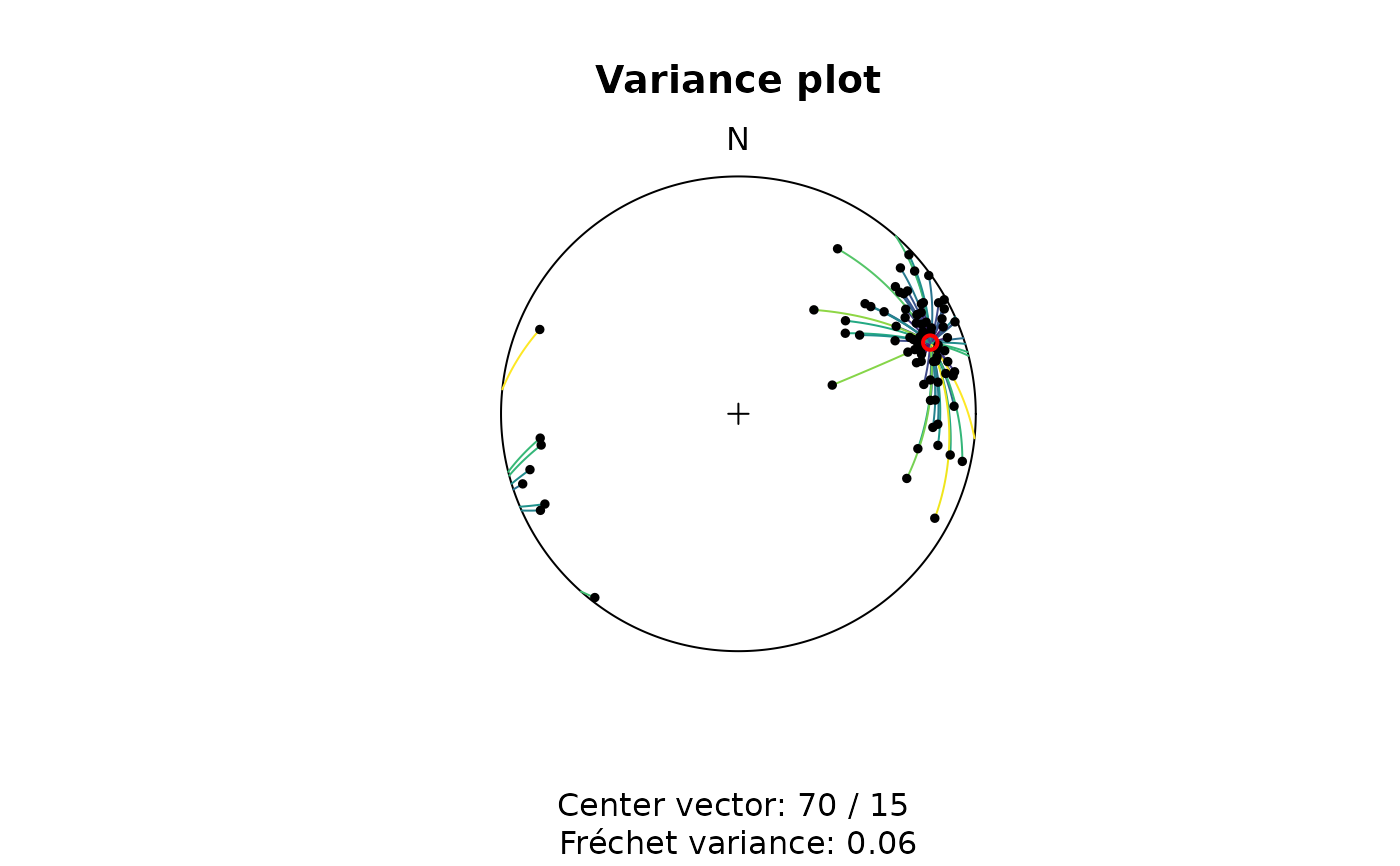
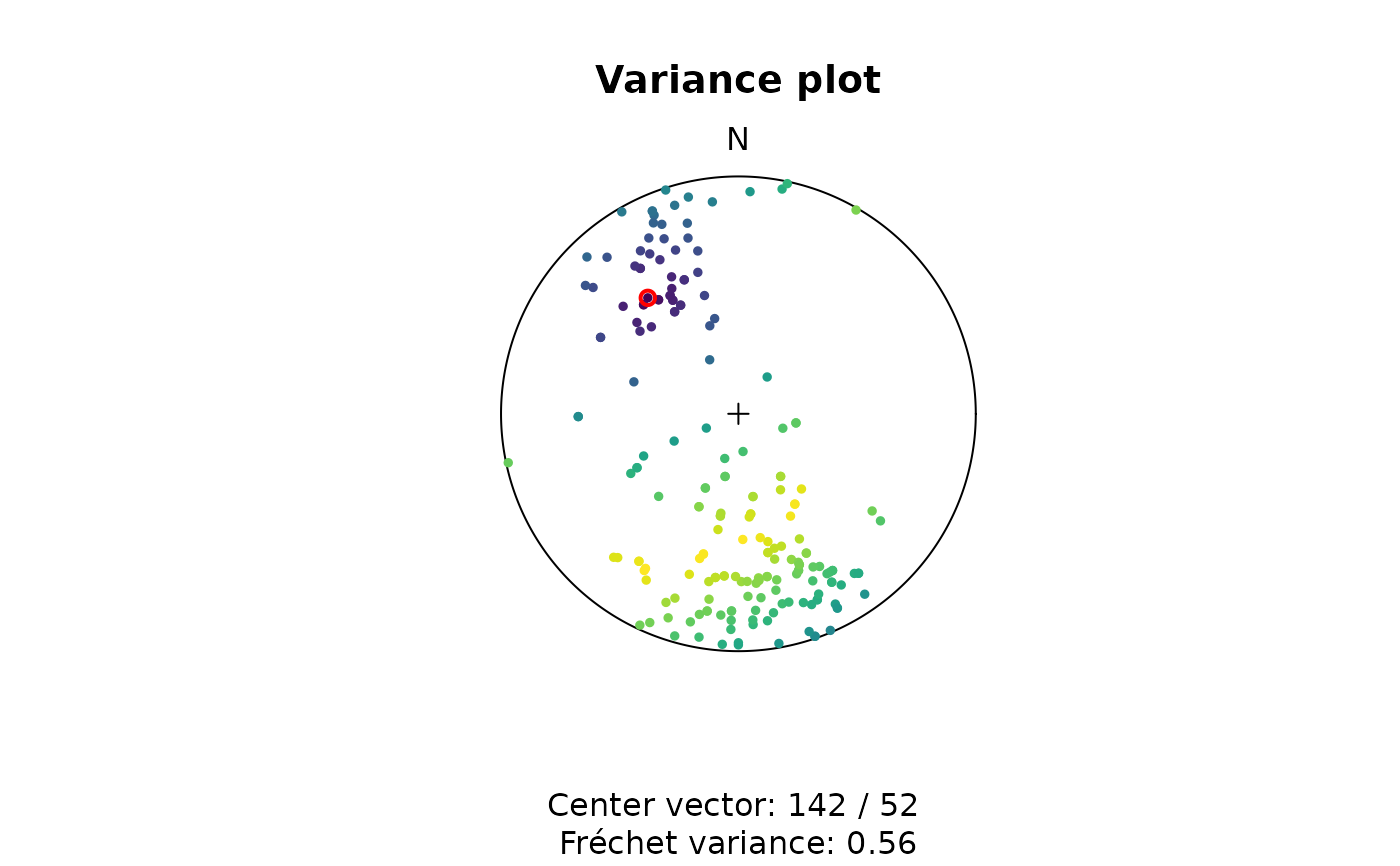
Shows the greatcircle of the shortest distance between a set of vectors to a specified vector in a stereoplot. The greatcircles are color-coded by the angular distance.
Usage
variance_plot(
  x,
  y = NULL,
  .mean = c("geodesic", "arithmetic", "projected"),
  show.center = TRUE,
  segments = TRUE,
  upper.hem = FALSE,
  earea = TRUE,
  ...
)
Arguments
- x
object of class
"Vec3","Line","Ray","Plane","Pair", or"Fault", where the rows are the observations and the columns are the coordinates.- y
The vector from which the variance should be visualized (only one vector allowed). When
NULL, then the mean vector ofxis used (the default).- .mean
character. The type of mean to be used if
yisNULL. One of"geodesic"(the default),"arithmetic"or"projected".- show.center
logical. Whether the center point
yof the mean should be highlighted in the plot.- segments
logical. Whether the segments should be shown or only the points?
- upper.hem
logical. Whether the projection is shown for upper hemisphere (
TRUE) or lower hemisphere (FALSE, the default).- earea
logical
TRUEfor Lambert equal-area projection (also "Schmidt net"; the default), orFALSEfor meridional stereographic projection (also "Wulff net" or "Stereonet").- ...
optional arguments passed to
assign_col()