Helper functions to assign plotting colors to a vector
Usage
assign_col_d(
  x,
  pal = colorblind_pal,
  na.translate = TRUE,
  na.values = "grey",
  ...
)

assign_col(
  x,
  n = length(x),
  pal = viridis::viridis,
  na.translate = TRUE,
  na.values = "grey",
  ...
)

assign_col_binned(x, breaks = 5L, pal = viridis::viridis, ...)

legend_col(breaks, title = NULL, pal = viridis::viridis, cex = 1, ...)

legend_col_d(fill, legend = names(fill), position = "topright", ...)
Arguments
- x
vector to colorize
- pal
color function; Default is
viridis::viridis()- na.translate
Unlike continuous scales, discrete scales can easily show missing values, and do so by default. If you want to remove missing values from a discrete scale, specify
na.translate = FALSE.- na.values
If
na.translate = TRUE, what color should the missing values be displayed as?- ...
arguments passed to color function
- n
integer. The number of colors (\(\ge\)1) to be in the palette.
- breaks
integer giving the desired number of intervals. Non-integer values are rounded down.
- title
character. Legend title
- cex
character expansion factor relative to current par("cex"). Used for text in legend.
- fill
color vector
- legend
character vector. Names of discrete colors. Can be ignored when
colsis a named vector.- position
Legend position. Either a two-column vector of the x and y coordinates, or a keyword from the list
"bottomright","bottom","bottomleft","left","topleft","top","topright","right"and"center".
See also
PlotTools::SpectrumLegend() - an alternative tool to generate a
color-bar in base-R plots
Other assign:
assign-cex,
assign-pch
Examples
set.seed(20250411)
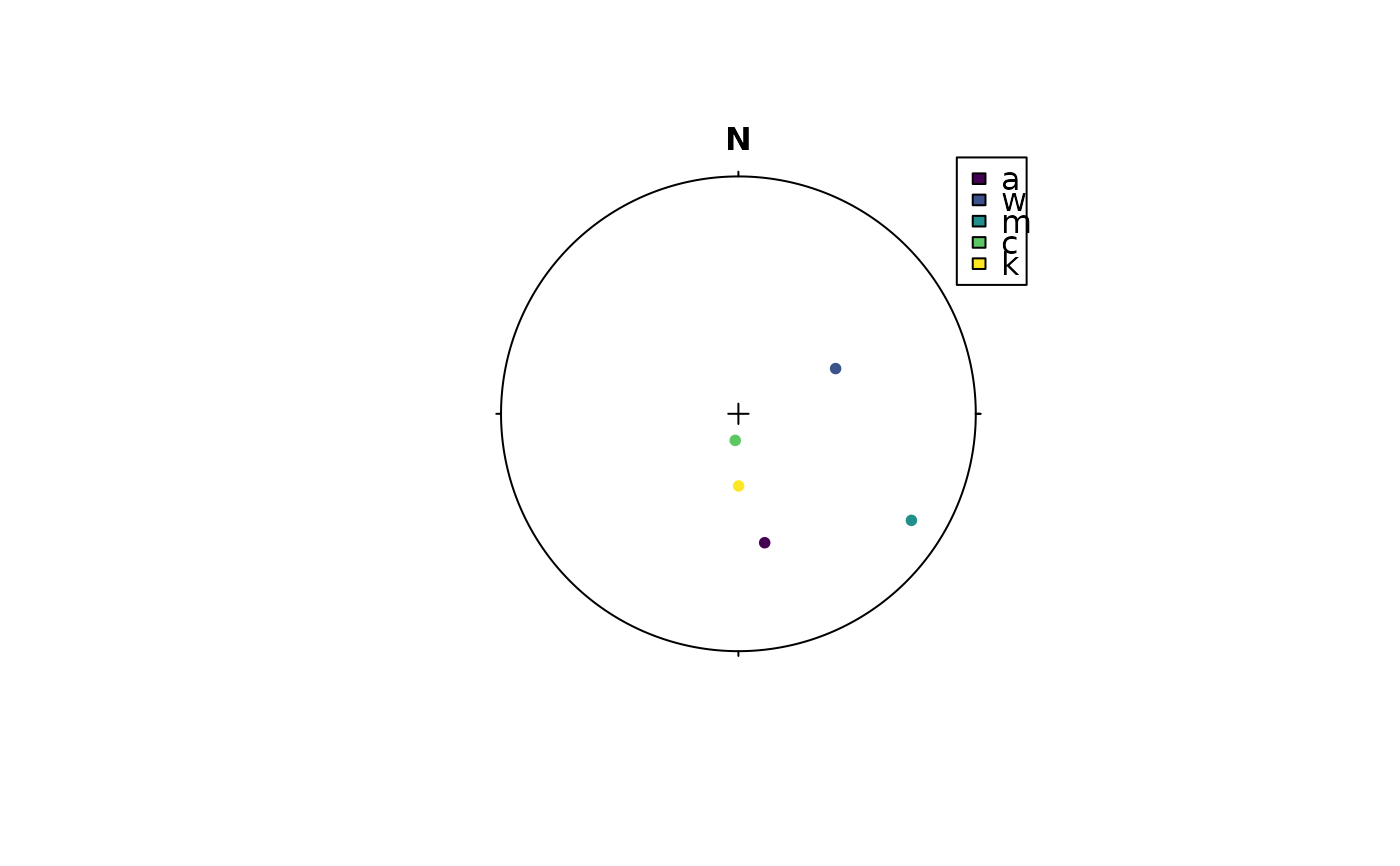
# example for discrete colors
x <- rvmf(5, mu = Line(120, 50), k = 5)
key <- letters[round(runif(5, 1, 26))]
key[2] <- NA
plot(x, col = assign_col_d(key), grid.params = list(guides = FALSE))
legend_col_d(assign_col_d(key))
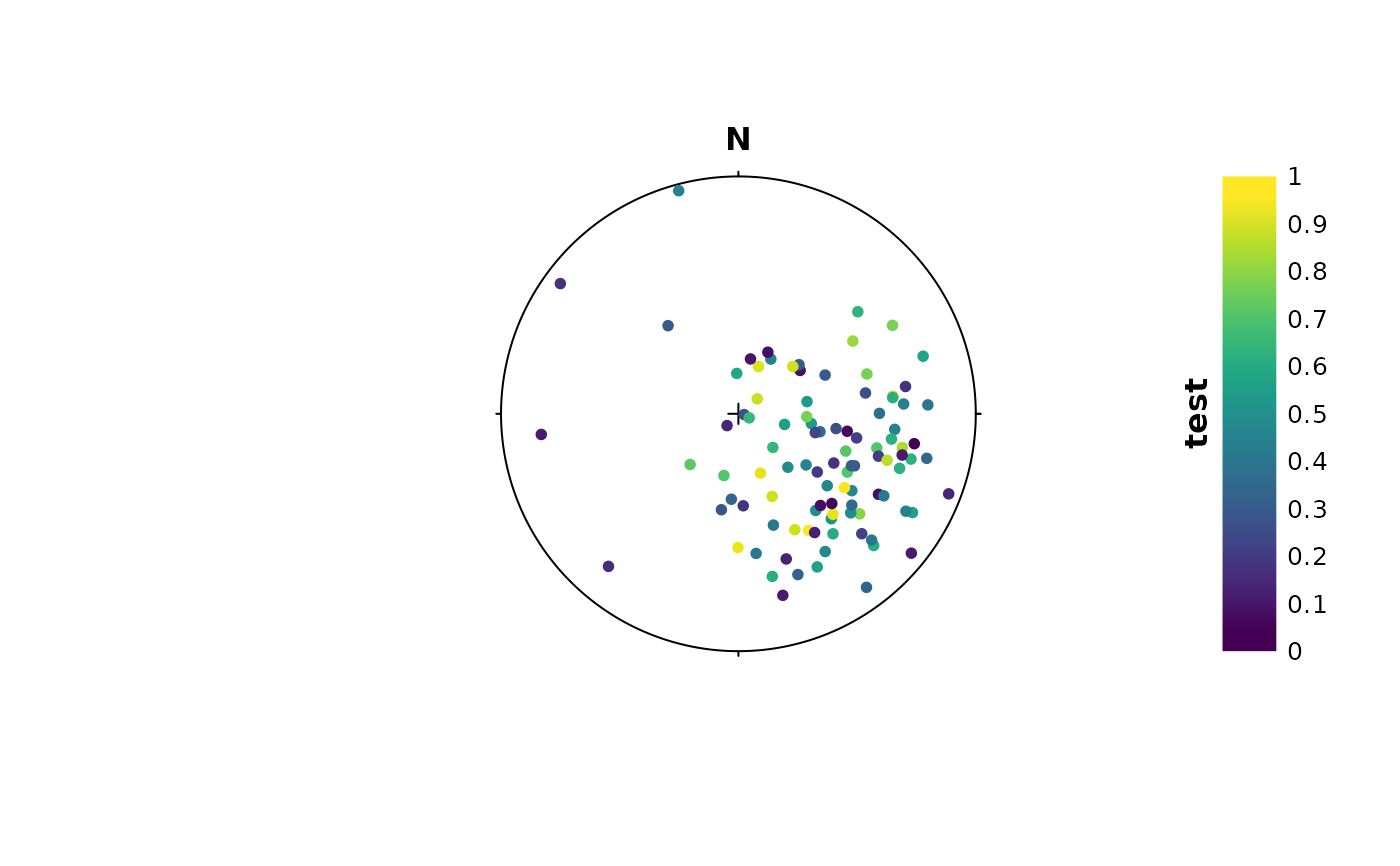
 # example for continuous colors:
x <- rvmf(100, mu = Line(120, 50), k = 5)
cols <- runif(100)
cols[sample.int(length(cols), size = 10)] <- NA
plot(x, col = assign_col(cols), grid.params = list(guides = FALSE))
legend_col(seq(0, 1, .1), title = "test")
# example for continuous colors:
x <- rvmf(100, mu = Line(120, 50), k = 5)
cols <- runif(100)
cols[sample.int(length(cols), size = 10)] <- NA
plot(x, col = assign_col(cols), grid.params = list(guides = FALSE))
legend_col(seq(0, 1, .1), title = "test")