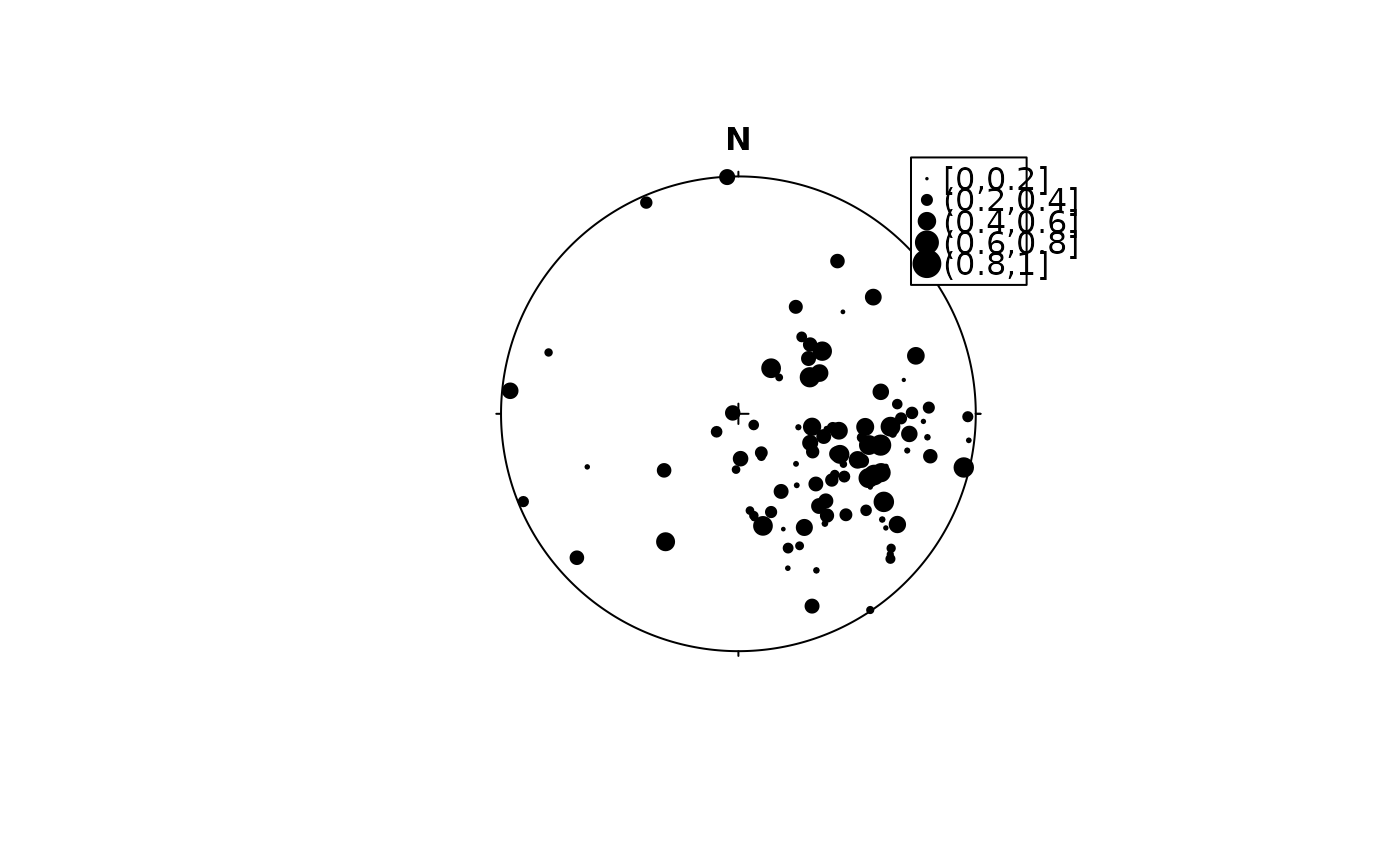
assign_cex() maps the character expansion (size).
The cex is most commonly used for points and text, and humans perceive the
area of points (not their radius), so this provides for optimal perception.
The argument area ensures that a value of 0 is mapped to a size of 0;
assign_cex_binned() is a binned version, and assign_cex_d() assigns
cex values to discrete values.
Arguments
- x
vector
- range
numeric 2-element vector. Output range of
cexvalues. Minimum value must be greater than 0.- area
logical. Whether
cexshould be proportional to the area (TRUE) or the radius (FALSE, the default) of the plotting character.- breaks
integer giving the desired number of intervals. Non-integer values are rounded down.
- values
numeric.
cexvalues to manually assign tox. Must be at least the number of unique values inx.- position
Legend position. Either a two-column vector of the x and y coordinates, or a keyword from the list
"bottomright","bottom","bottomleft","left","topleft","top","topright","right"and"center".- pch
plotting character to be used in legend.
- ...
arguments passed to
graphics::legend()
Details
The character expansion cex is a number indicating the amount by
which plotting text and symbols
should be scaled relative to the default. 1=default, 1.5 is 50% larger,
0.5 is 50% smaller, etc.
See also
PlotTools::SizeLegend() - alternative tool to generate nice
looking legends for cex values
Other assign:
assign-color,
assign-pch

