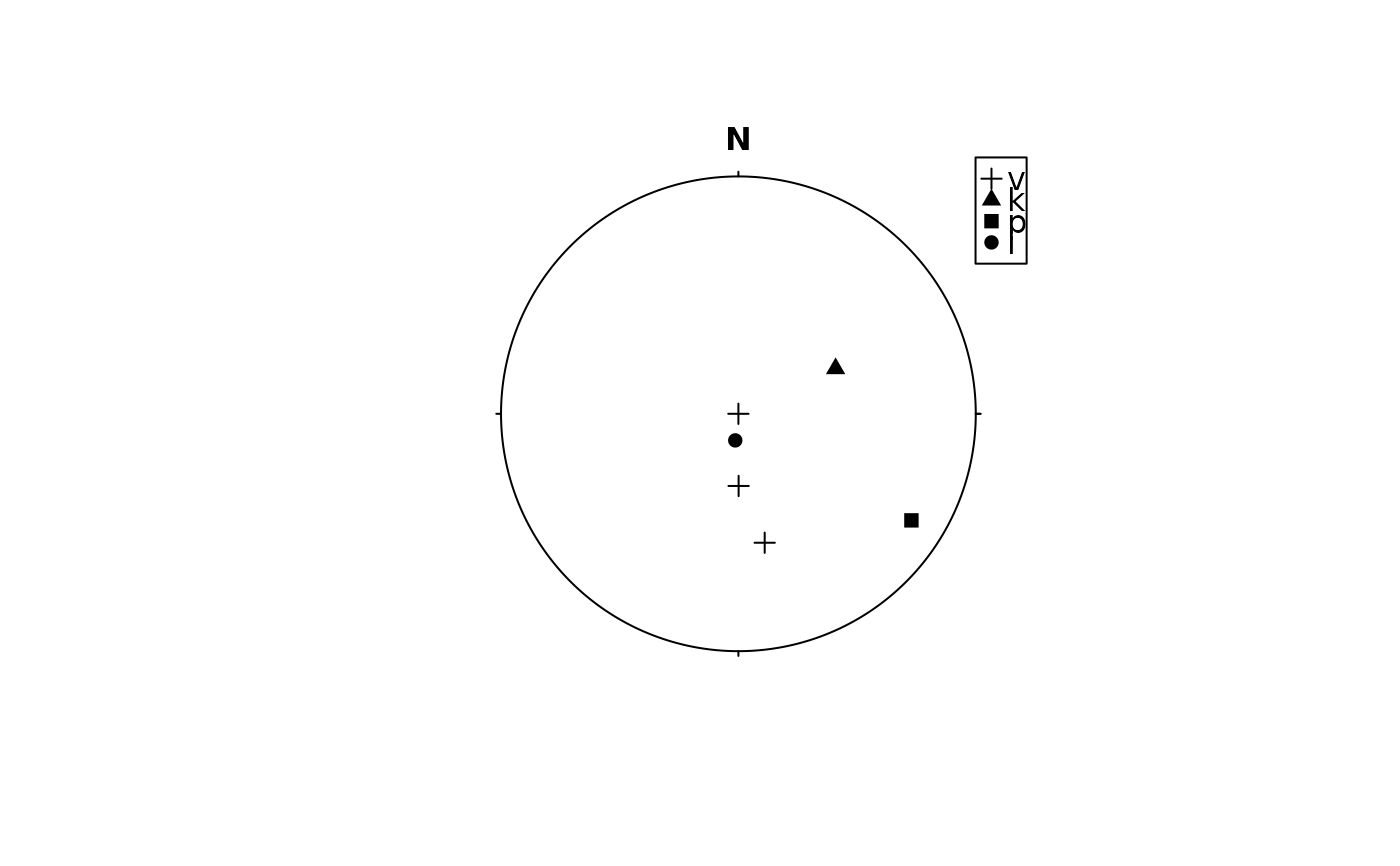
assign_pch() maps discrete variables to six easily discernible shapes. If you have more
than six levels, you will get a warning message, and the seventh and
subsequent levels will not appear on the plot.
You can not map a continuous variable to shape unless assign_pch_binned() is
used.
Usage
assign_pch(x, solid = TRUE)

assign_pch_binned(x, solid = TRUE, breaks = 6)

legend_pch(x, solid = TRUE, breaks = NULL, position = "topright", ...)
Arguments
- x
vector.
- solid
Should the plotting character be solid,
TRUE(the default), or hollow,FALSE?- breaks
integer giving the desired number of intervals. Non-integer values are rounded down.
- position
Legend position. Either a two-column vector of the x and y coordinates, or a keyword from the list
"bottomright","bottom","bottomleft","left","topleft","top","topright","right"and"center".- ...
arguments passed to
graphics::legend()
See also
Other assign:
assign-cex,
assign-color