Test against the null-hypothesis that the samples are drawn from the same Fisher population.
Arguments
- x, y
objects of class
"Vec3","Line", or"Plane", , where the rows are the observations and the columns are the coordinates.- alpha
numeric. Significance level for the confidence angle (default is 0.05 for a 95% confidence angle).
- na.rm
logical. Whether
NAvalues should be removed before the computation proceeds.
Examples
set.seed(20250411)
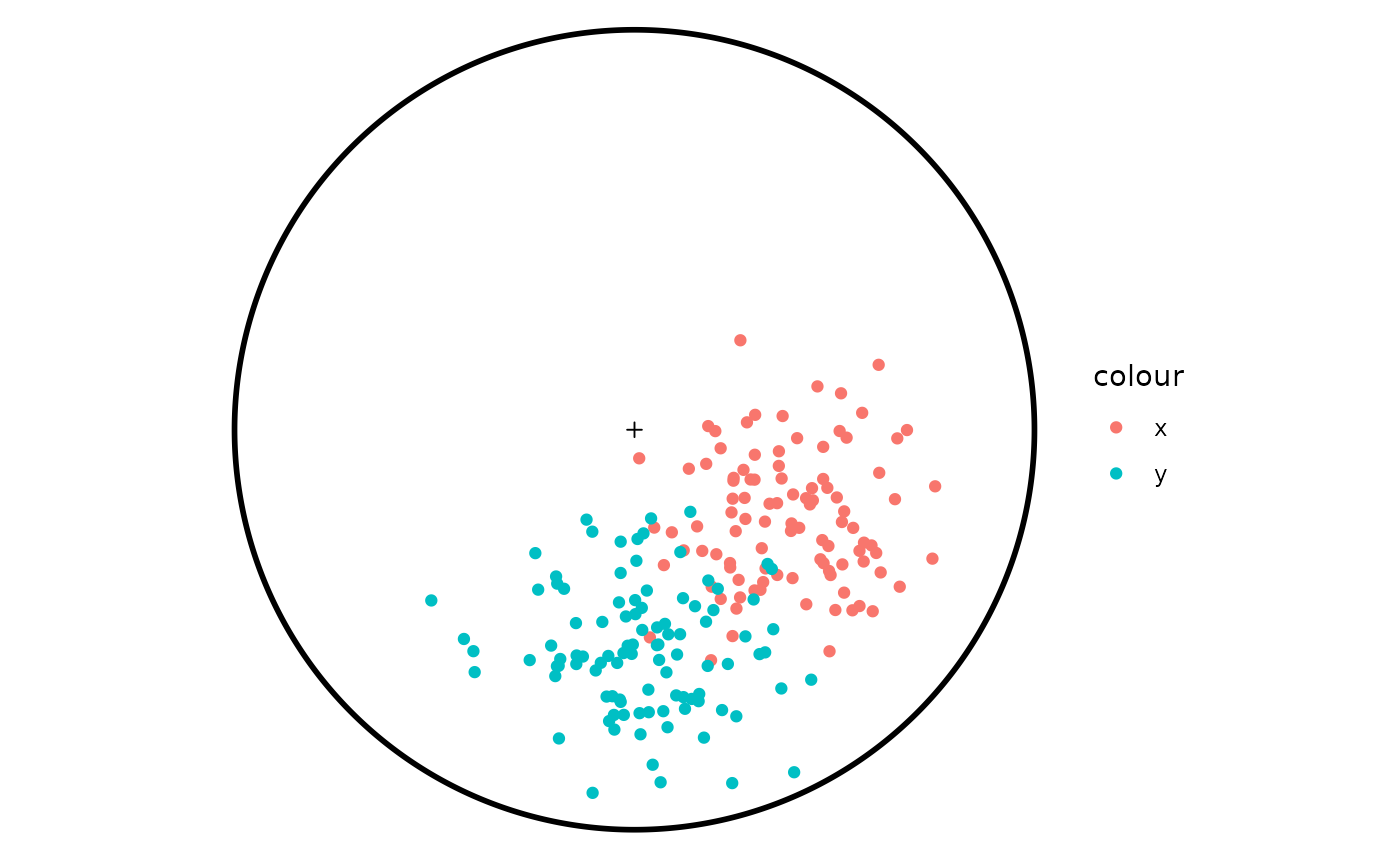
x <- rvmf(100, mu = Line(120, 50), k = 20)
y <- rvmf(100, mu = Line(180, 45), k = 20)

stereoplot()
stereo_point(x, col = 1)
stereo_point(y, col = 2)


fisher_ftest(x, y)
#> Reject null-hypothesis
#>    F stat   p-value
#> 264.17684   3.01851
