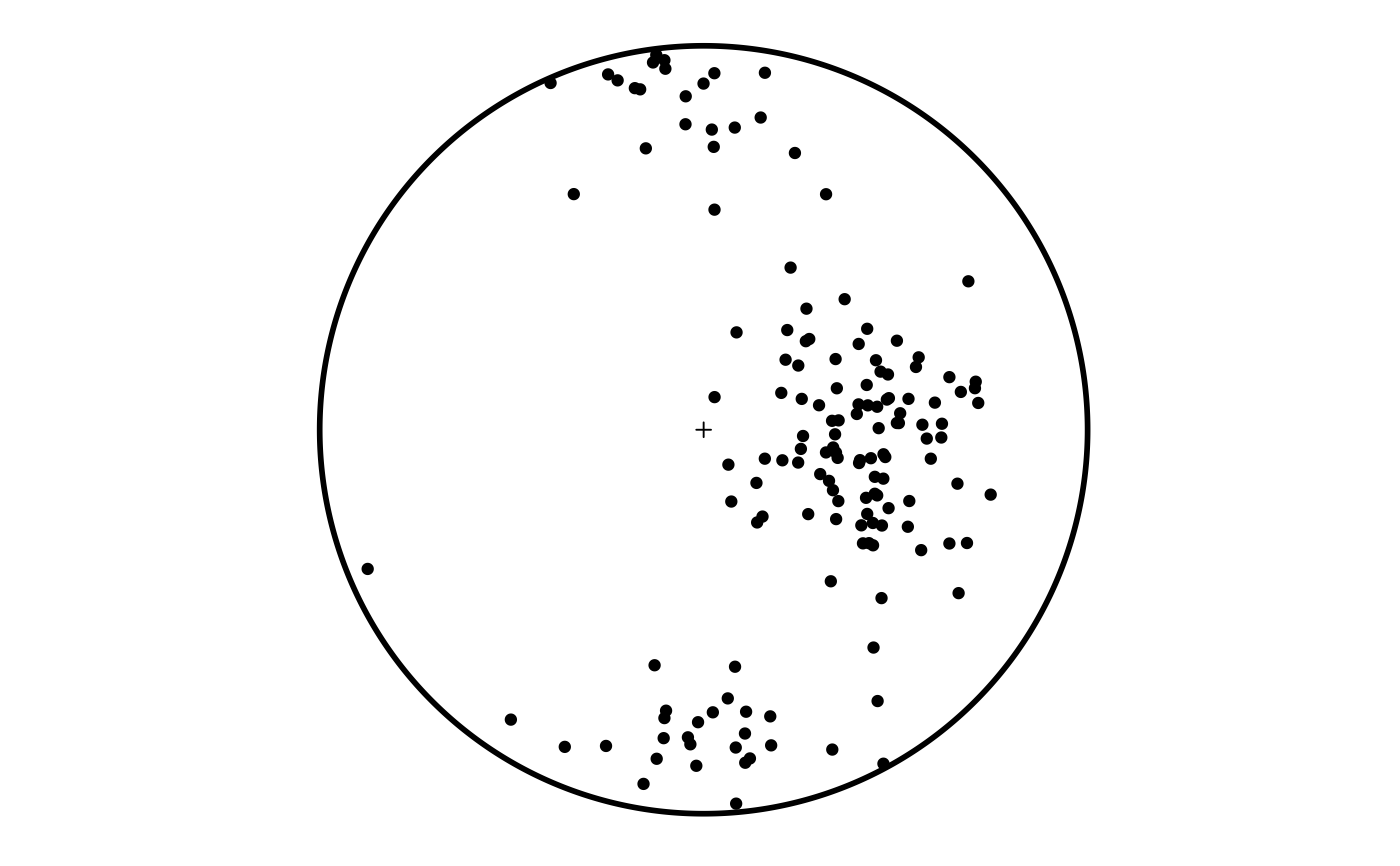
Stereoplot using ggplot
Usage
ggstereo(
  data = NULL,
  mapping = aes(),
  earea = TRUE,
  centercross = TRUE,
  grid = FALSE,
  grid.spacing = 10,
  grid.rot = 0,
  ...
)
Arguments
- data
Default dataset to use for plot. If not already a data.frame, will be converted to one by
ggplot2::fortify(). If not specified, must be supplied in each layer added to the plot.- mapping
Default list of aesthetic mappings to use for plot. If not specified, must be supplied in each layer added to the plot.
- earea
logical. Whether the projection is equal-area ("Schmidt net") (
TRUE, the default), or equal-angle ("Wulff net") (FALSE).- centercross
logical. Whether a center cross should be added.
- grid
logical. Whether a grid should be added.
- grid.spacing
numeric. Grid spacing in degree
- grid.rot
numeric. Angle (in degrees) to rotate the grid.
- ...
argument passed to
ggplot2::geom_polygon()
Examples
if (require("mapproj")) {
  test_data <- rbind(
    rvmf(100, mu = Line(90, 45), k = 10),
    rvmf(50, mu = Line(0, 0), k = 20)
  )

  ggstereo(grid = TRUE) +
    ggplot2::geom_point(data = gg(test_data), ggplot2::aes(x = x, y = y))

  ggstereo(earea = FALSE, centercross = TRUE) +
    ggplot2::geom_point(data = gg(test_data), ggplot2::aes(x = x, y = y))
}
#> Loading required package: mapproj
#> Loading required package: maps

