2. Stereographic projections
Tobias Stephan
2025-09-02
Source:vignettes/2_Stereographic_projection.Rmd
2_Stereographic_projection.RmdImport and convert to spherical objects:
data(example_planes)

planes <- Plane(example_planes$dipdir, example_planes$dip)
lines <- Line(example_lines$trend, example_lines$plunge)
Stereographic projection
Lambert equal area, lower hemisphere projection is the default plotting setting.
stereoplot()
points(lines, col = "#B63679", pch = 19, cex = .5)
points(planes, col = "#000004", pch = 1, cex = .5)
legend("topright", legend = c("Lines", "Planes"), col = c("#B63679", "#000004"), pch = c(19, 1), cex = 1)
title(main = "Example data", sub = "Lambert equal area, lower hemisphere projection")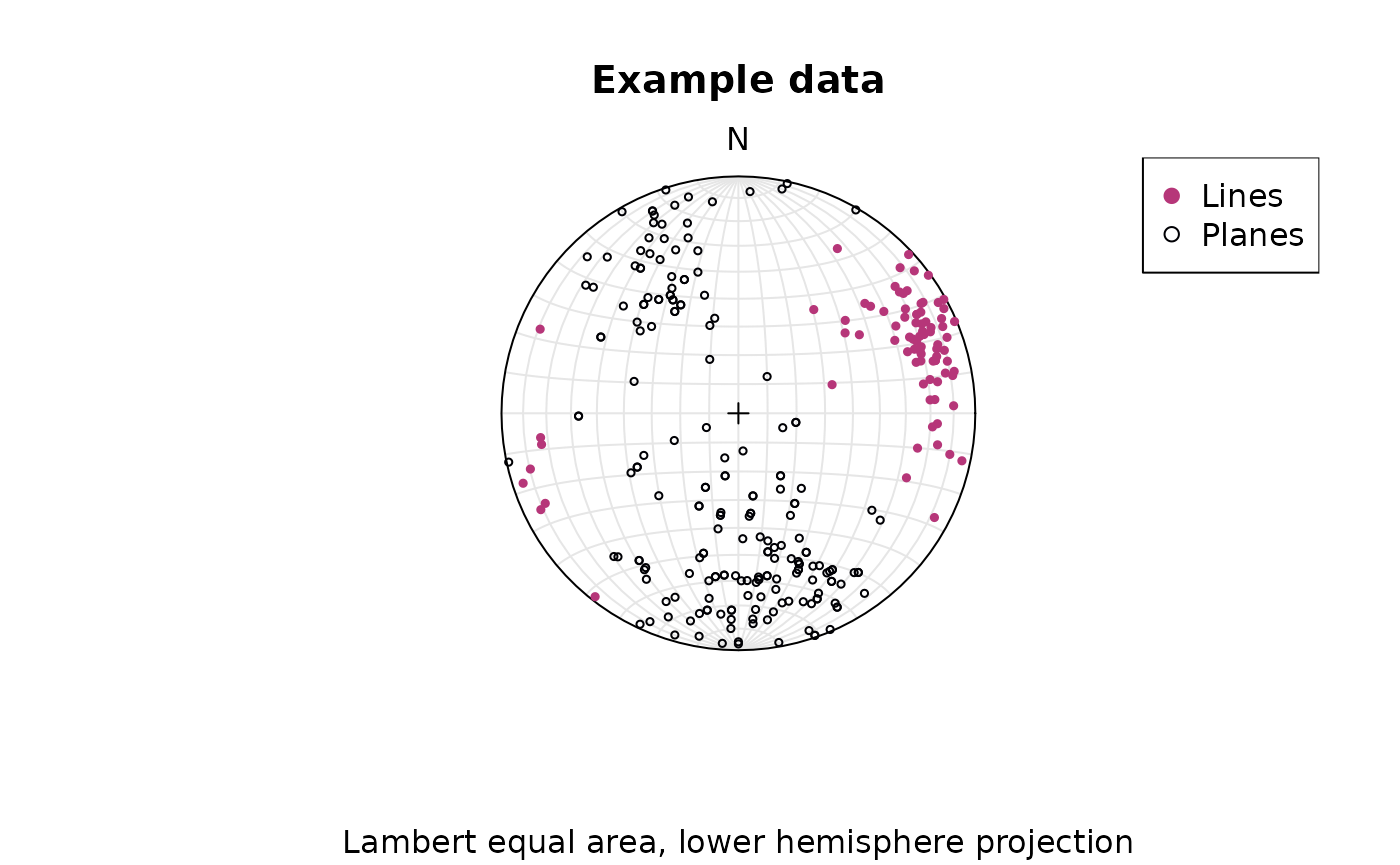
To change to equal angle stereographic, upper hemisphere projection
stereoplot(earea = FALSE)
points(lines, col = "#B63679", pch = 19, cex = .5, earea = FALSE, upper.hem = TRUE)
points(planes, col = "#000004", pch = 1, cex = .5, earea = FALSE, upper.hem = TRUE)
legend("topright", legend = c("Lines", "Planes"), col = c("#B63679", "#000004"), pch = c(19, 1), cex = 1)
title(main = "Example data", sub = "Equal angle stereographic, upper hemisphere projection")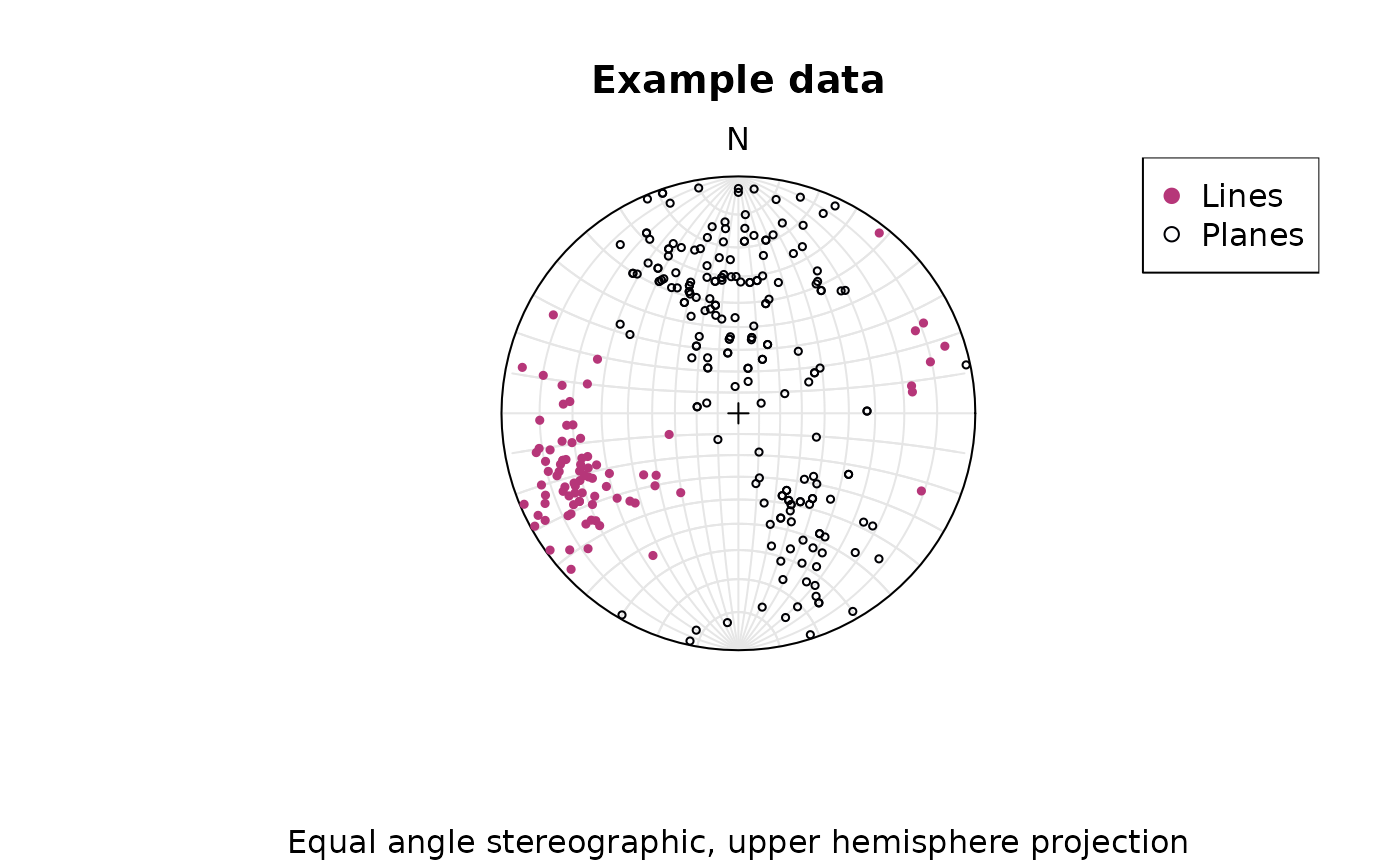
Adding great circles:
stereoplot(guides = FALSE)
lines(planes, col = "lightgrey", lty = 1, d = 90)
points(planes, col = "#000004", pch = 1, cex = .5)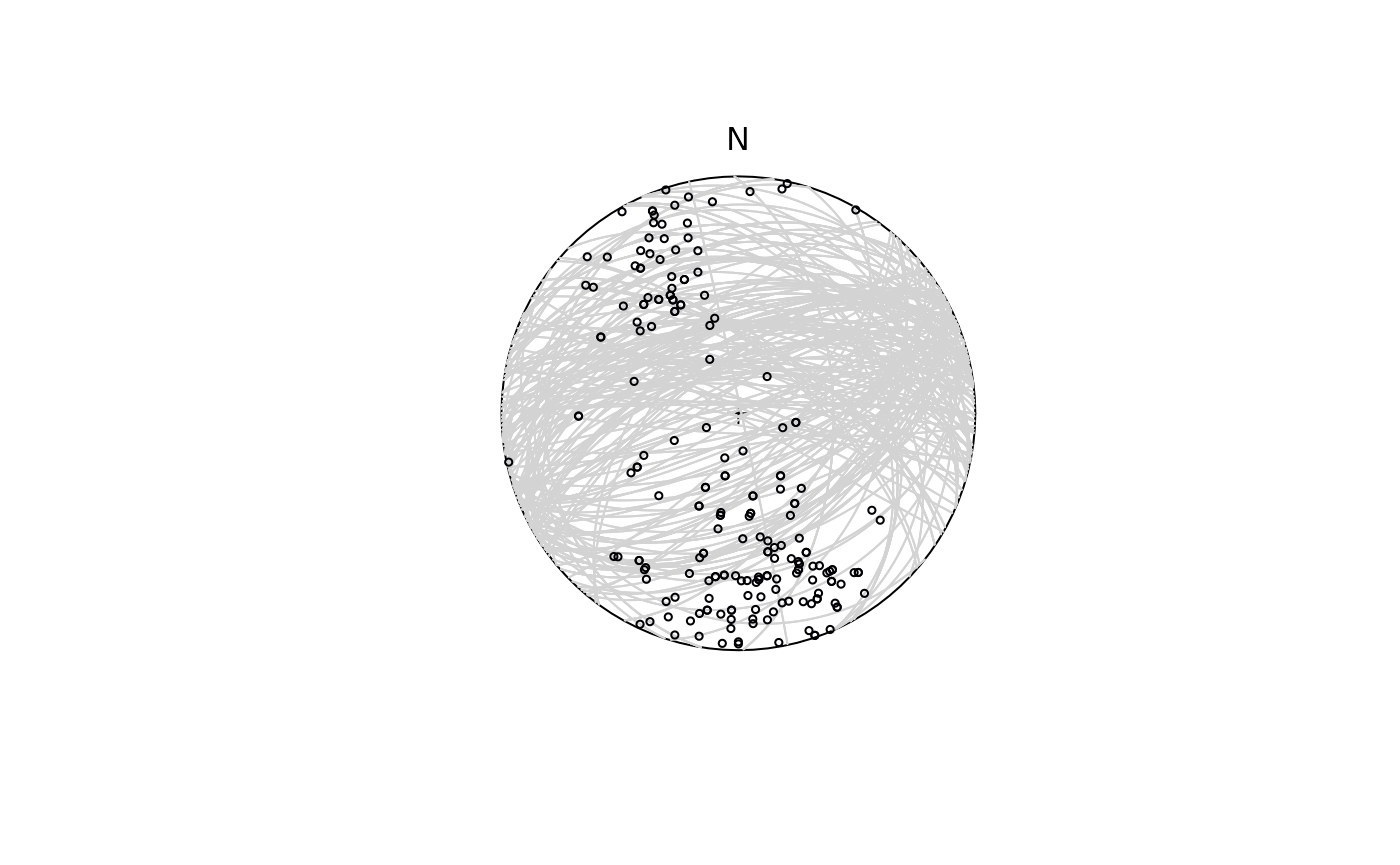
Statistics
example_lines$quality <- ifelse(is.na(example_lines$quality), 6, example_lines$quality) # replacing NA values with 6
line_weightings <- 6 / example_lines$quality
lines_mean <- mean(lines, w = line_weightings)
lines_variance <- var(lines, w = line_weightings)
lines_delta <- delta(lines, w = line_weightings)
lines_confangle <- confidence_angle(lines, w = line_weightings)
c(
  "Variance" = lines_variance,
  "63% cone" = lines_delta,
  "Confidence angle" = lines_confangle
)
#>         Variance         63% cone Confidence angle
#>        0.1938084       36.2745102        6.9017035
stereoplot(guides = FALSE)
points(lines, col = "lightgrey", pch = 1, cex = .5)
points(lines_mean, col = "#B63679", pch = 19, cex = 1)
lines(lines_mean, d = lines_confangle, col = "#E65164FF")
lines(lines_mean, d = lines_delta, col = "#FB8861FF")
legend("topright", legend = c("Mean line", "95% confidence cone", "63% data cone"), col = c("#B63679", "#E65164FF", "#FB8861FF"), pch = c(19, NA, NA), lty = c(NA, 1, 1), cex = .75)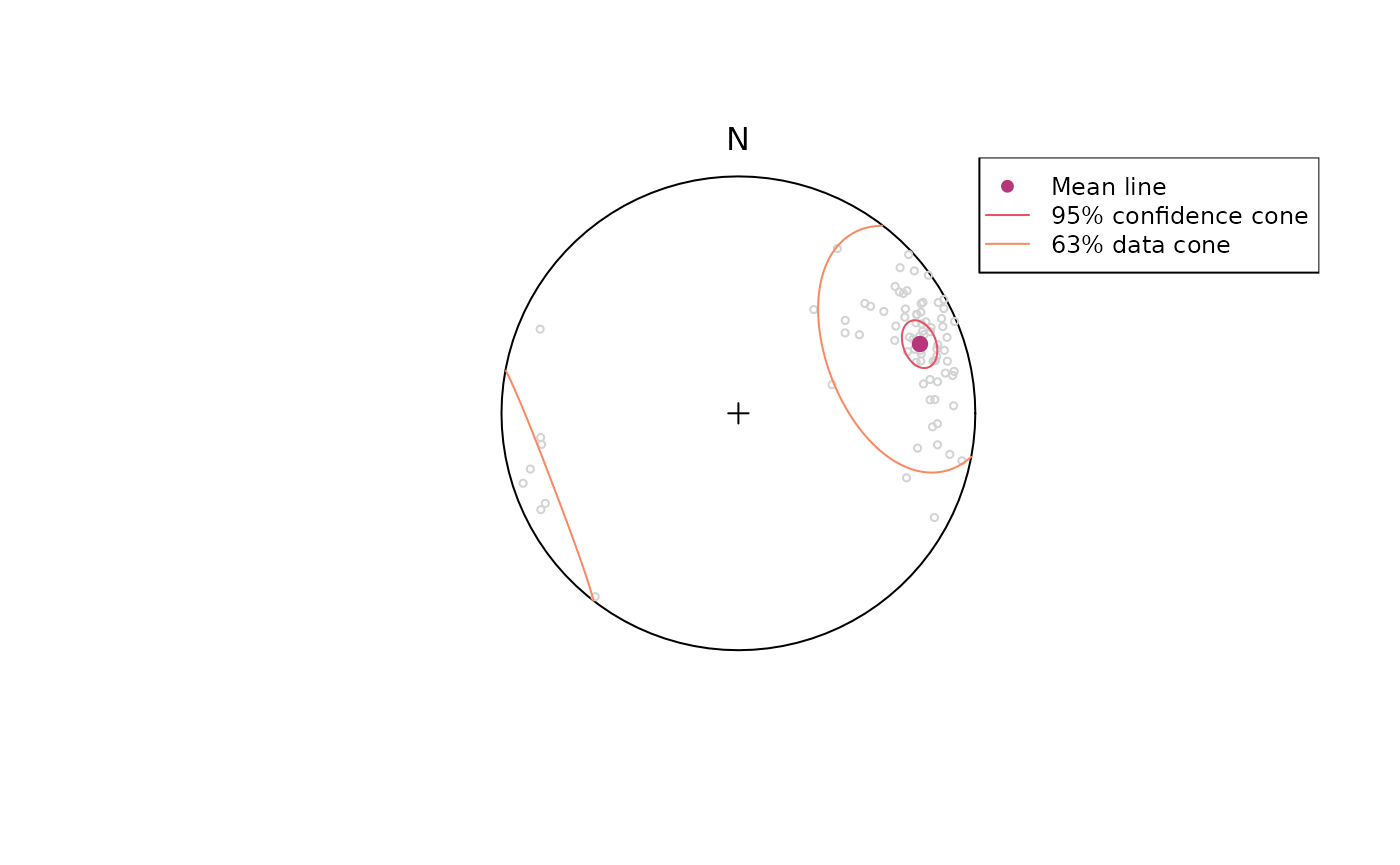
Orientation tensor and eigenvectors:
planes_eigen <- eigen(planes)

stereoplot(guides = FALSE)
points(planes, col = "lightgrey", pch = 1, cex = .5)
lines(planes_eigen$vectors, d = 90, col = viridis::magma(3), lty = 1)
points(planes_eigen$vectors, col = viridis::magma(3), pch = 19, cex = 1)
legend("topright", legend = c("Eigenvectors 1", "Eigenvectors 2", "Eigenvectors 3"), col = viridis::magma(3), pch = 19, cex = .75)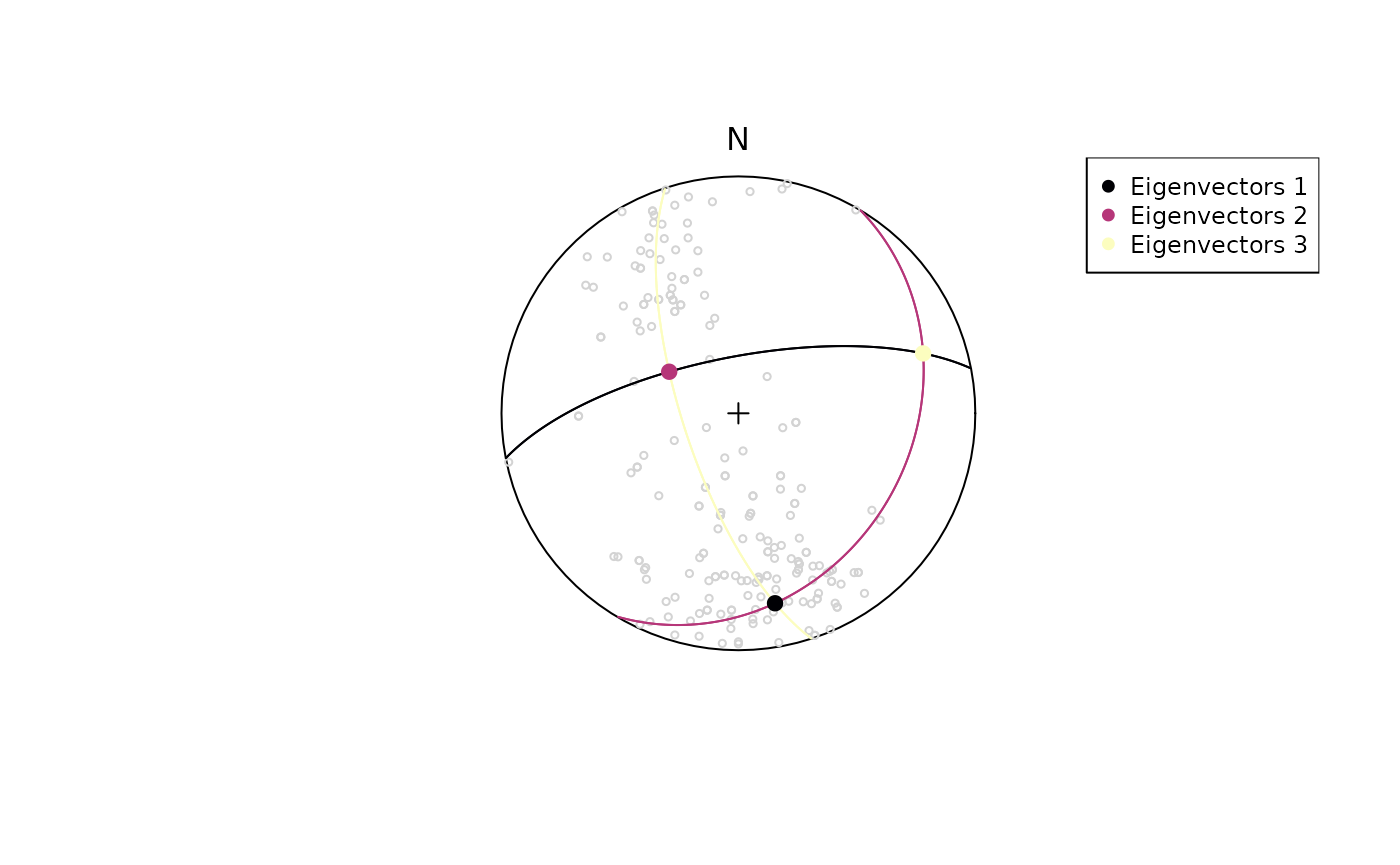
Fabric plots
VollmerPlot(planes, col = "#000004", pch = 1, cex = 2)
VollmerPlot(lines, add = TRUE, col = "#B63679", pch = 19, cex = 2)
legend("topright", legend = c("Lines", "Planes"), col = c("#B63679", "#000004"), pch = c(19, 1), cex = 1)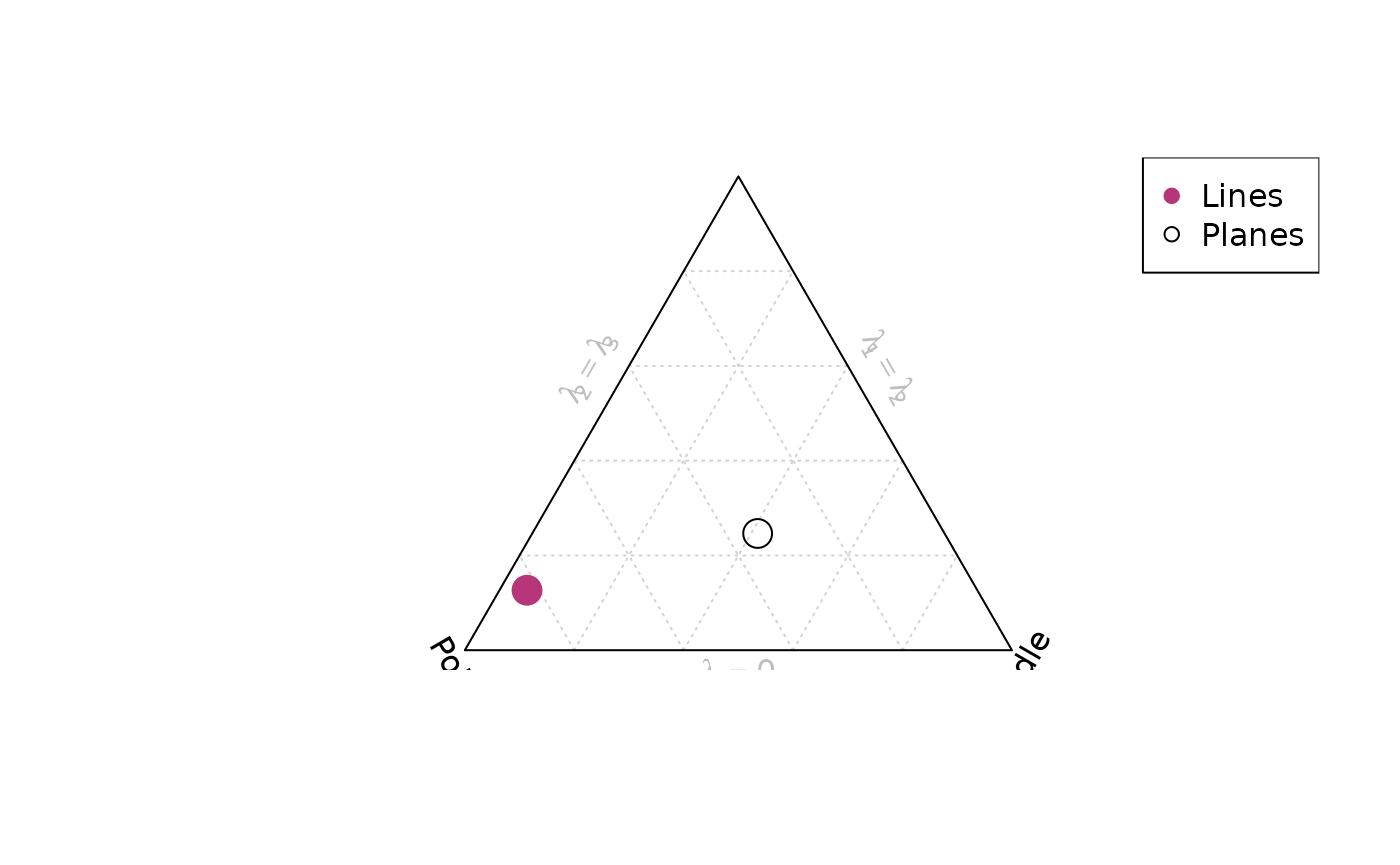
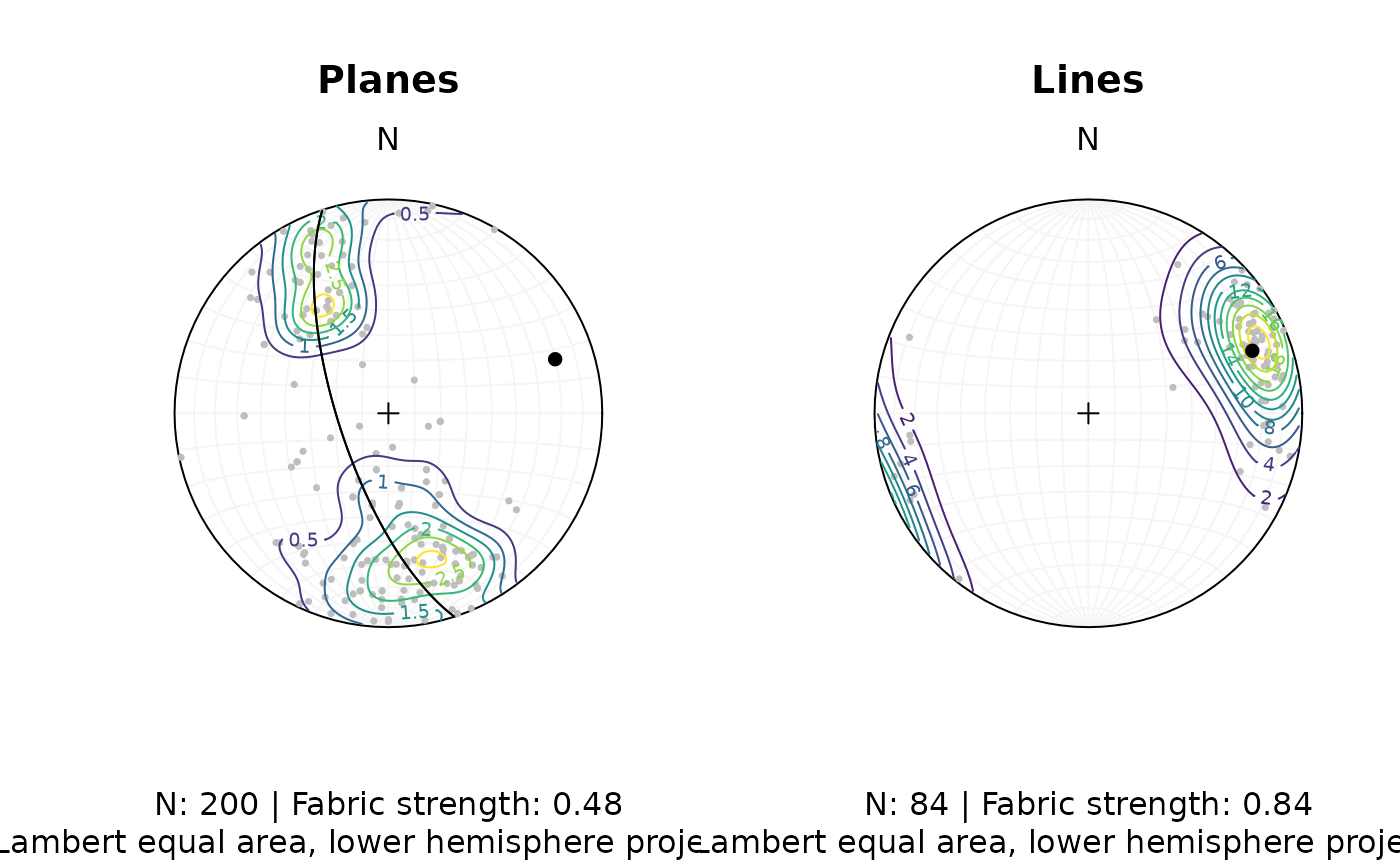
Density plots
example_planes$quality <- ifelse(is.na(example_planes$quality), 6, example_planes$quality) # replacing NA values with 6
plane_weightings <- 6 / example_planes$quality

fabric_p <- or_shape_params(planes)$Vollmer["D"]
fabric_l <- or_shape_params(lines)$Vollmer["D"]

par(mfrow = c(1, 2))
stereoplot(guides = TRUE, col = "grey96")
points(planes, col = "grey", pch = 16, cex = .5)
contour(planes, add = TRUE, weights = plane_weightings)
points(planes_eigen$vectors[3, ], col = "black", pch = 16)
lines(planes_eigen$vectors[3, ], d = 90, col = "black", pch = 16)
title(
  main = "Planes",
  sub = paste0(
    "N: ", nrow(planes), " | Fabric strength: ", round(fabric_p, 2),
    "\nLambert equal area, lower hemisphere projection"
  )
)

stereoplot(guides = TRUE, col = "grey96")
points(lines, col = "grey", pch = 16, cex = .5)
contour(lines, add = TRUE, weights = line_weightings)
points(lines_mean, col = "black", pch = 16)
title(
  main = "Lines",
  sub = paste0(
    "N: ", nrow(lines), " | Fabric strength: ", round(fabric_l, 2),
    "\nLambert equal area, lower hemisphere projection"
  )
)