Prepare points and lines for ggplot
Arguments
- x
object of class
"Vec3","Line","Ray","Plane","Pair", or"Fault", where the rows are the observations and the columns are the coordinates.- ...
<data-masking>Name-value pairs. The name gives the name of the column in the output. The value can be:A vector of length 1, which will be recycled to the correct length.
A vector the same length as the current group (or the whole data frame if ungrouped).
NULL, to remove the column.A data frame or tibble, to create multiple columns in the output.
- d
numeric. Cone angle (small circle radius) in degrees.
90(the default) produces great circles.- n
integer. Resolution of line.
Examples
if (require("mapproj")) {
x <- Plane(120, 85)
ggstereo() +
ggplot2::geom_point(data = gg(x), ggplot2::aes(x, y), color = "red") +
ggplot2::geom_path(data = ggl(x), ggplot2::aes(x, y), color = "red")
x2 <- Line(120, 5)
ggstereo() +
ggplot2::geom_point(data = gg(x2), ggplot2::aes(x, y), color = "darkgreen") +
ggplot2::geom_path(
data = ggl(x2, d = 8),
ggplot2::aes(x, y, group = group), color = "darkgreen"
)
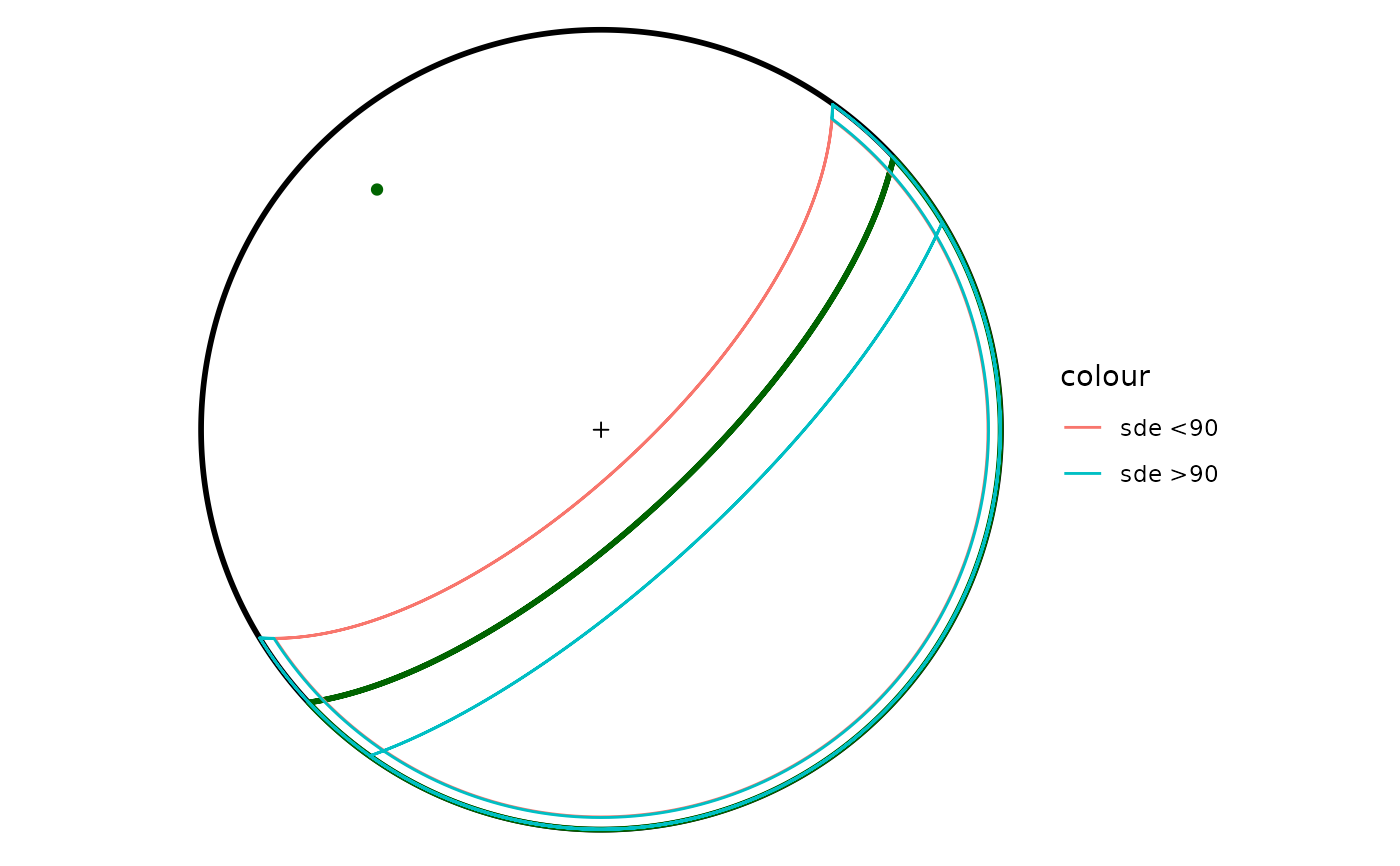
x3 <- Plane(137, 71)
ggstereo() +
ggplot2::geom_point(data = gg(x3), ggplot2::aes(x, y), color = "darkgreen") +
ggplot2::geom_path(
data = ggl(x3, d = 90),
ggplot2::aes(x, y, group = group), color = "darkgreen", lwd = 1
) +
ggplot2::geom_path(
data = ggl(x3, d = 90 + 11),
ggplot2::aes(x, y, group = group, color = "sde <90")
) +
ggplot2::geom_path(
data = ggl(x3, d = 90 - 11),
ggplot2::aes(x, y, group = group, color = "sde >90")
)
}