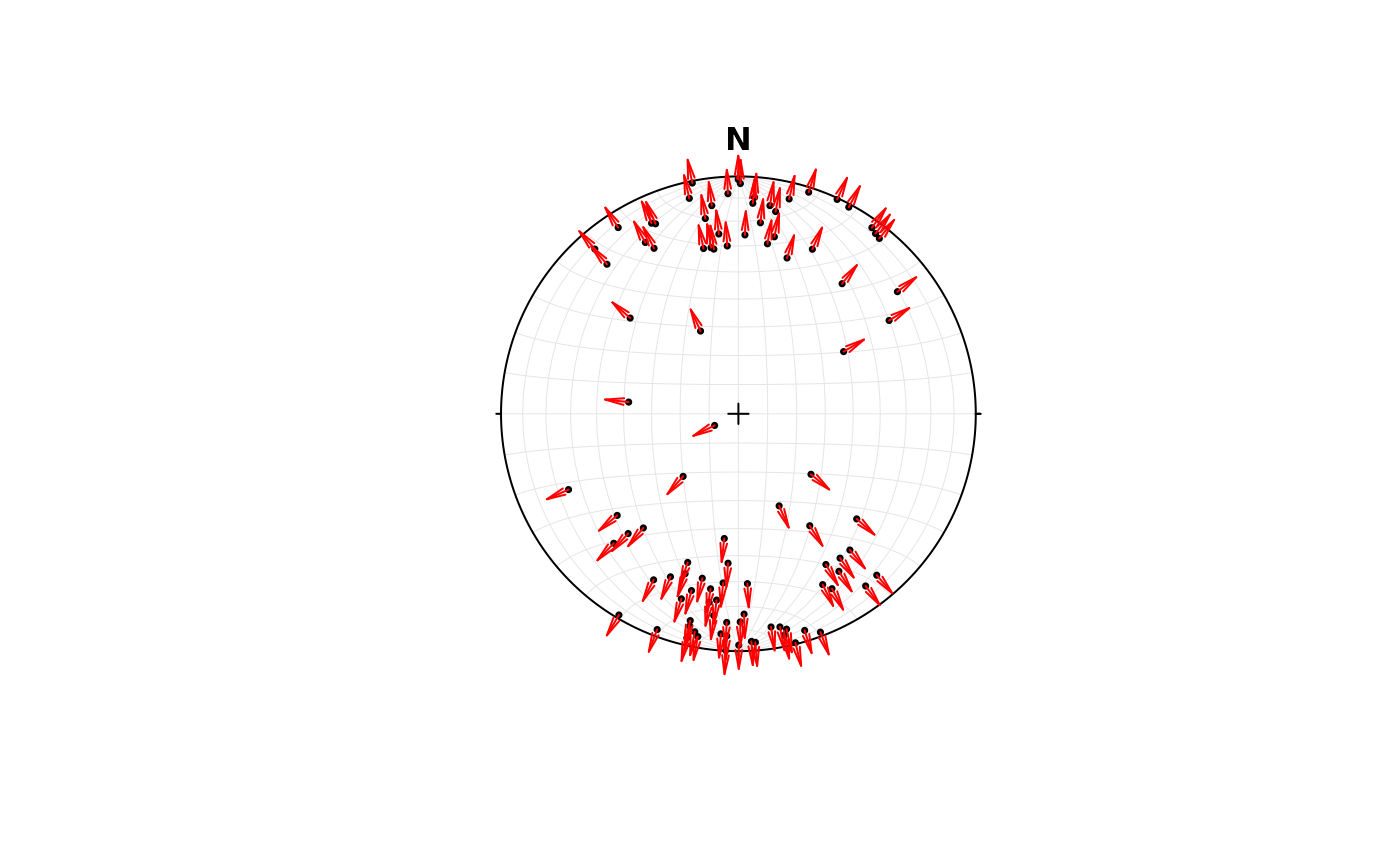
A quiver plot displays displacement vectors into pointing into the direction of movement.
Usage
stereo_arrows(
  x,
  sense,
  scale = 0.1,
  angle = 10,
  length = 0.1,
  upper.hem = NULL,
  earea = NULL,
  ...
)

stereo_hoeppener(
  pole,
  slip,
  scale = 0.1,
  angle = 10,
  length = 0.1,
  upper.hem = NULL,
  earea = NULL,
  ...
)

# S3 method for class 'spherical'
arrows(
  x,
  sense,
  scale = 0.1,
  angle = 10,
  length = 0.1,
  upper.hem = NULL,
  earea = NULL,
  ...
)
Arguments
- x
object of class
"Vec3","Line","Ray", or"Plane", where the rows are the observations and the columns are the coordinates.- sense
numeric. Sense of the line on a fault plane. Either
1or-1for normal or thrust offset, respectively. The"sense"is the sign of the fault's rake (seeFault_from_rake()for details).- scale
numeric. Scales the length of the vector.
0.1by default- angle
numeric. Angle from the shaft of the arrow to the edge of the arrow head.
- length
numeric. Length of the edges of the arrow head (in inches).
- upper.hem
logical. Whether the projection is shown for upper hemisphere (
TRUE) or lower hemisphere (FALSE). Defaults togetOption("structr.upper.hem").- earea
logical. Projection, either
TRUEfor Lambert equal-area projection, orFALSEfor meridional stereographic projection. Defaults togetOption("structr.earea").- ...
arguments passed to
graphics::arrows()- pole, slip
spherical object. The plane normal and a slip vector
Examples
set.seed(20250411)
stereoplot()
p <- rvmf(n = 100)
stereo_arrows(p, sense = 1, col = "red")