
Uncertainties of direction stress inversion after Yamaji and Sato (2006)
Source:R/stress_inversion_yamaji.R
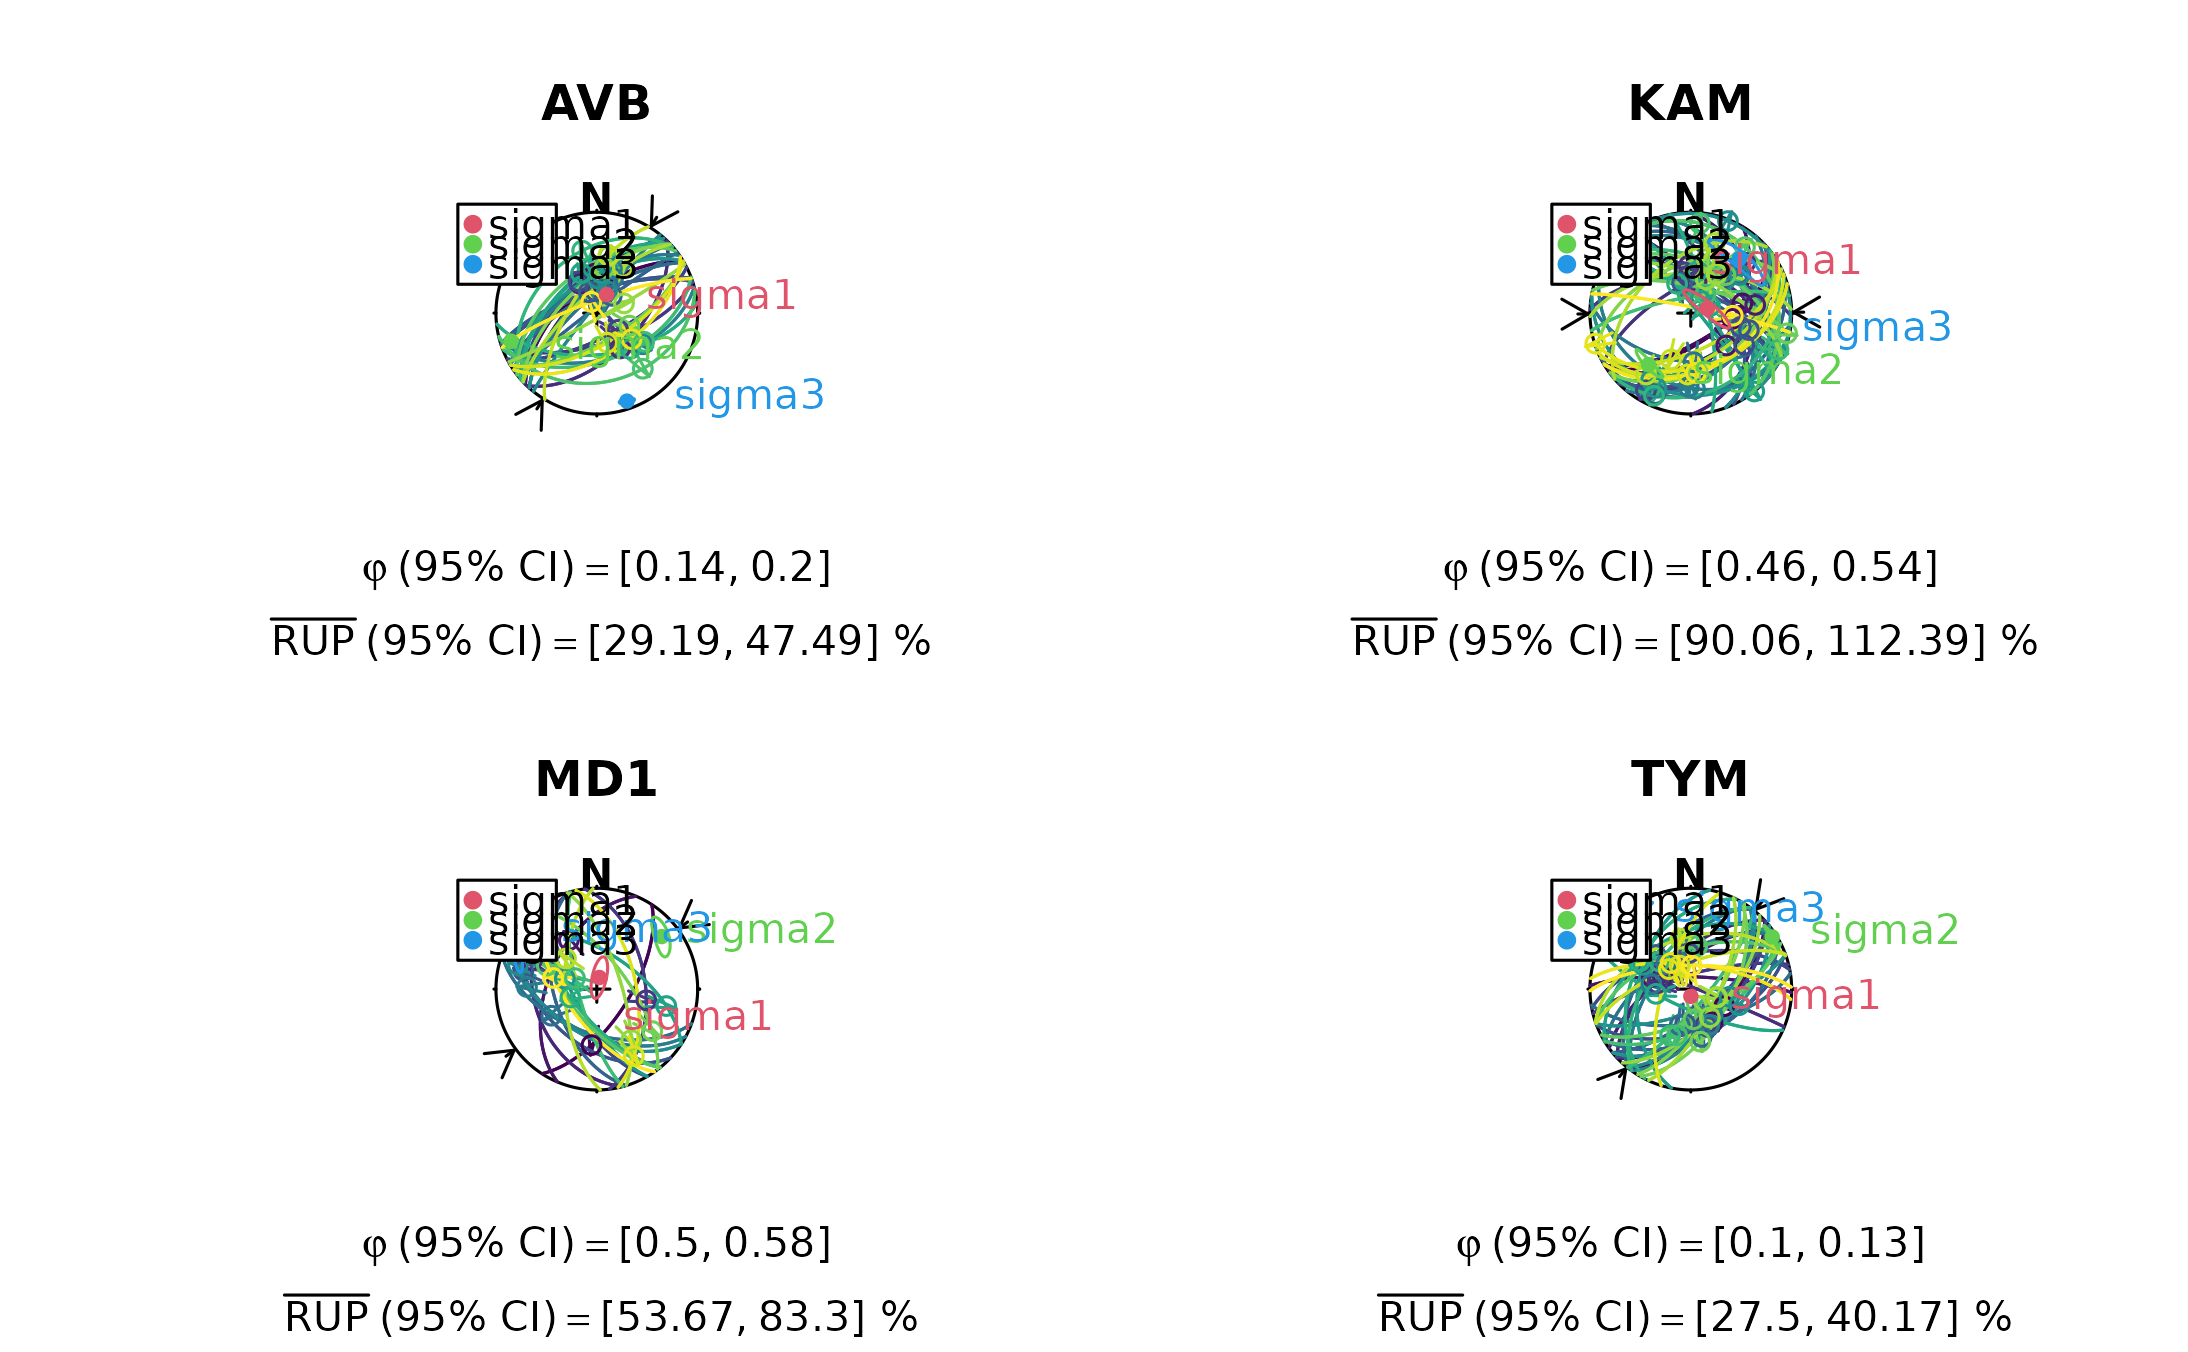
slip_inversion_yamaji_sato_boot.RdBootstrap resampling to evaluate solution precision (Section 6). Yields B stress tensors from resampled datasets. The dispersion of these tensors on \(S^5\) approximates the noise level of the data (Eq. 37).
Usage
slip_inversion_yamaji_sato_boot(
  x,
  weights = NULL,
  n_iter = 100L,
  conf.level = 0.95,
  flip = FALSE,
  ...
)
Arguments
- x
object of class
"Pair"or"Fault"with at least 4 rows.- weights
numeric. Weightings for the faults. Must have the same length as
x- n_iter
integer. Number of bootstrap replicates (100 by default)
- conf.level
numeric. Confidence level of the interval (0.95 by default)
- flip
logical. Flip if you want to have the negative stress tensor, i.e. sigma 1 and 3 will be flipped.
- ...
optional parameters passed to
confidence_ellipse()
Value
List identical to slip_inversion_michael() and additional list entries:
thetalength-B vector of angular stress distances from optimal
dispersionmean angular stress distance (Theta-bar); approximates the noise level p of the data (Fig. 8 of paper)
sdstandard deviation of Theta values
D_barmean Orife-Lisle distance from optimal
DM_barmean Michael distance from optimal
See also
Other yamaji:
slip_inversion_yamaji_sato()
Examples
set.seed(20250411)
# Use Angelier examples:
nx <- length(angelier1990)
par(mfrow = c(2, length(angelier1990)/2))
invisible(lapply(seq_len(nx), function(i) {
# inversion
x <- angelier1990[[i]]
res <- slip_inversion_yamaji_sato_boot(x, n_iter = 100, n = 1000, res = 100)
# some stress shape
phi_val <- round(res$phi_CI, 2)
# misfit
rup_val <- round(res$rup_CI, 2)
# Plot the faults (color-coded by RUP%) and show the principal stress axes
stereoplot(guides = FALSE)
stereo_shmax(res$SHmax)
fault_plot(x, col = assign_col(res$misfit$rup))
stereo_confidence(res$principal_axes_CI$sigma1, col = 2)
stereo_confidence(res$principal_axes_CI$sigma2, col = 3)
stereo_confidence(res$principal_axes_CI$sigma3, col = 4)
text(res$principal_axes, label = rownames(res$principal_axes), col = 2:4, adj = -.25)
legend("topleft", col = 2:4, legend = rownames(res$principal_axes), pch = 16)
title(
main = names(angelier1990)[i],
sub = bquote(atop(varphi ~ "(95% CI)" == "[" * .(phi_val[1]) * "," ~ .(phi_val[2]) * "]",
~ bar("RUP") ~ "(95% CI)" == "[" * .(rup_val[1]) * "," ~ .(rup_val[2]) * "] %")
))
}))
 dev.off()
#> null device
#> 1
dev.off()
#> null device
#> 1