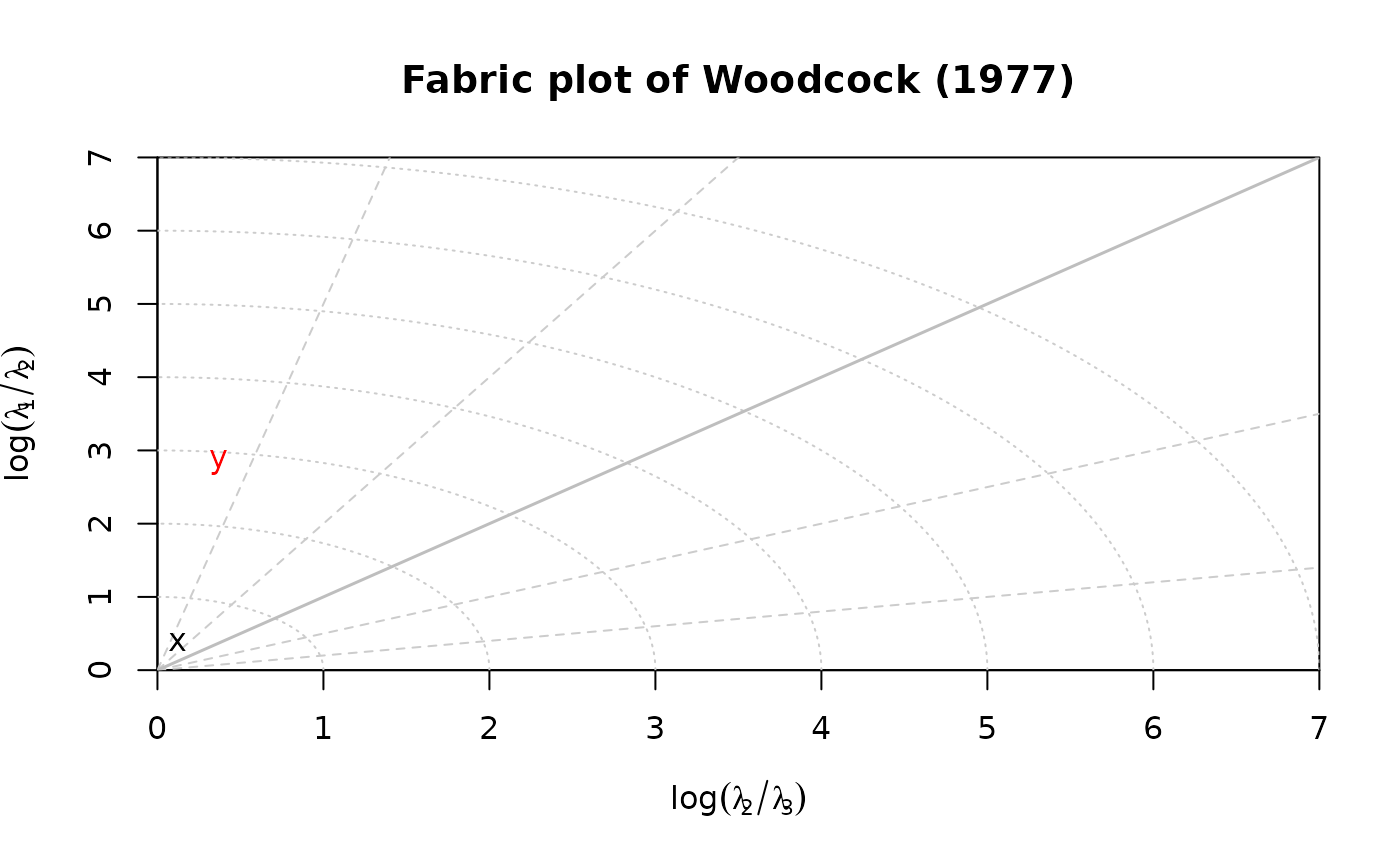
Creates a fabric plot using the eigenvalue method
Usage
woodcock_plot(
  x,
  labels = NULL,
  add = FALSE,
  max = 7,
  main = "Woodcock diagram",
  weights = NULL,
  guides = NULL,
  ...
)
Arguments
- x
either an object of class
"Vec3","Line","Ray","Plane","Pair", or"Fault"where the rows are the observations and the columns are the coordinates, or an"ortensor"object.- labels
character. text labels
- add
logical. Should data be plotted to an existing plot?
- max
numeric. Maximum value for x and y axes. If
NULL, it is calculated from the data.- main
character. The main title for the plot.
- weights
numeric. Weightings
- guides
logical. Whether guides should be added to the plot. Defaults to
getOption("structr.guides").- ...
optional graphical parameters
Value
A plot and when stored as an object, the orientation tensor's eigenvalues and eigenvectors as a list.
References
Woodcock, N. H. (1977). Specification of fabric shapes using an eigenvalue method. Geological Society of America Bulletin88, 1231<U+2013>1236.
See also
Other fabric-plot:
flinn_plot(),
hsu_plot(),
vollmer-plot