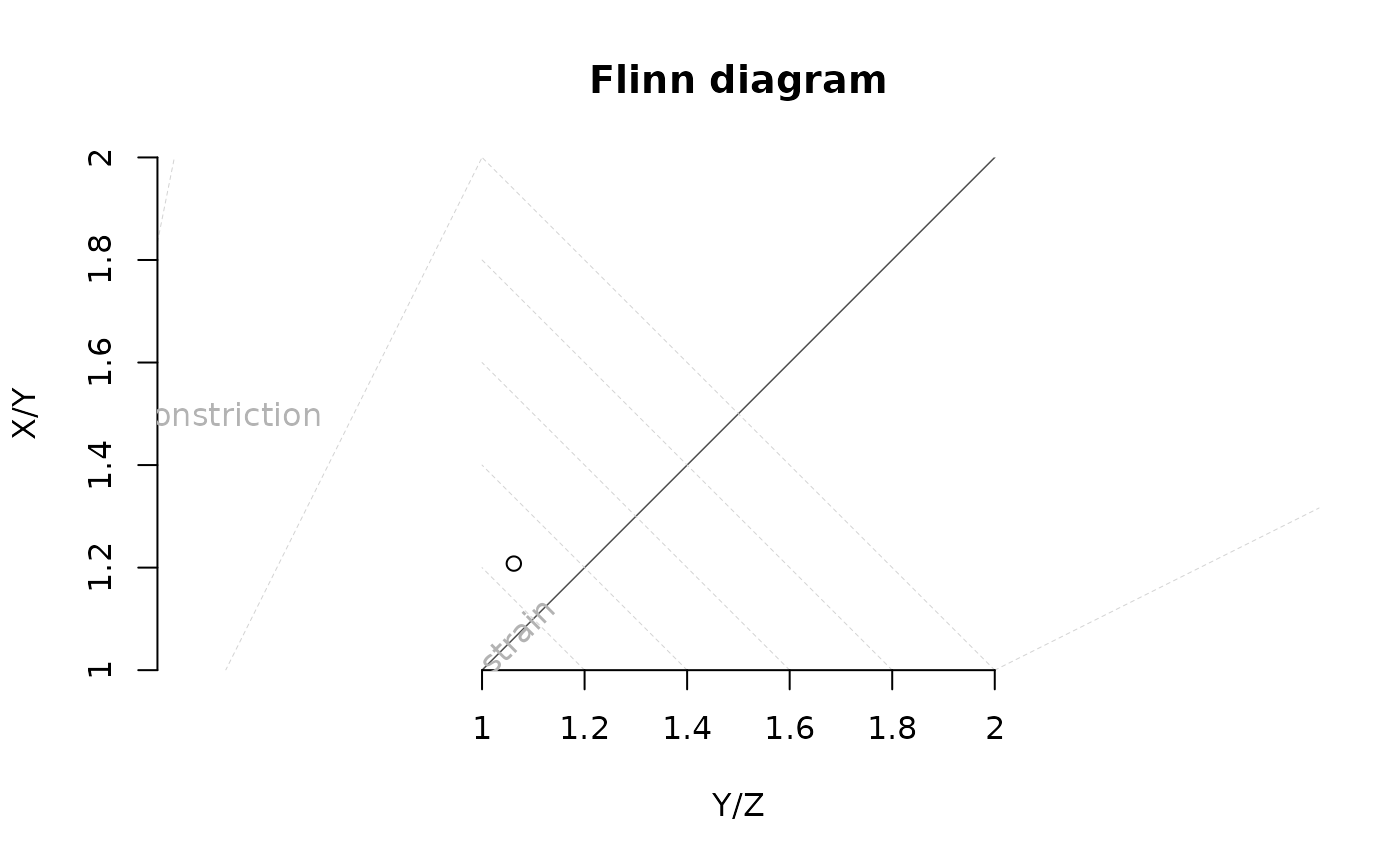
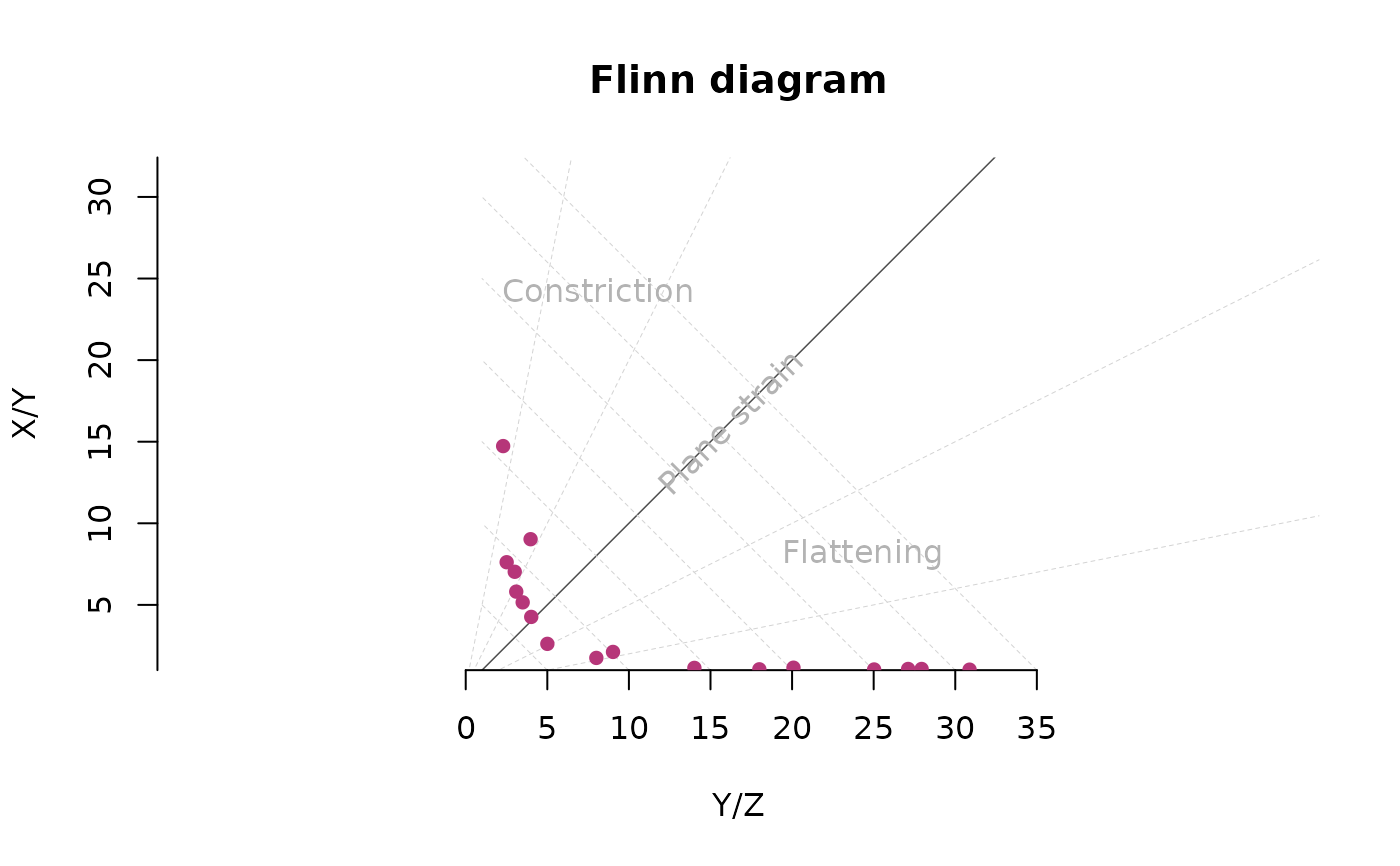
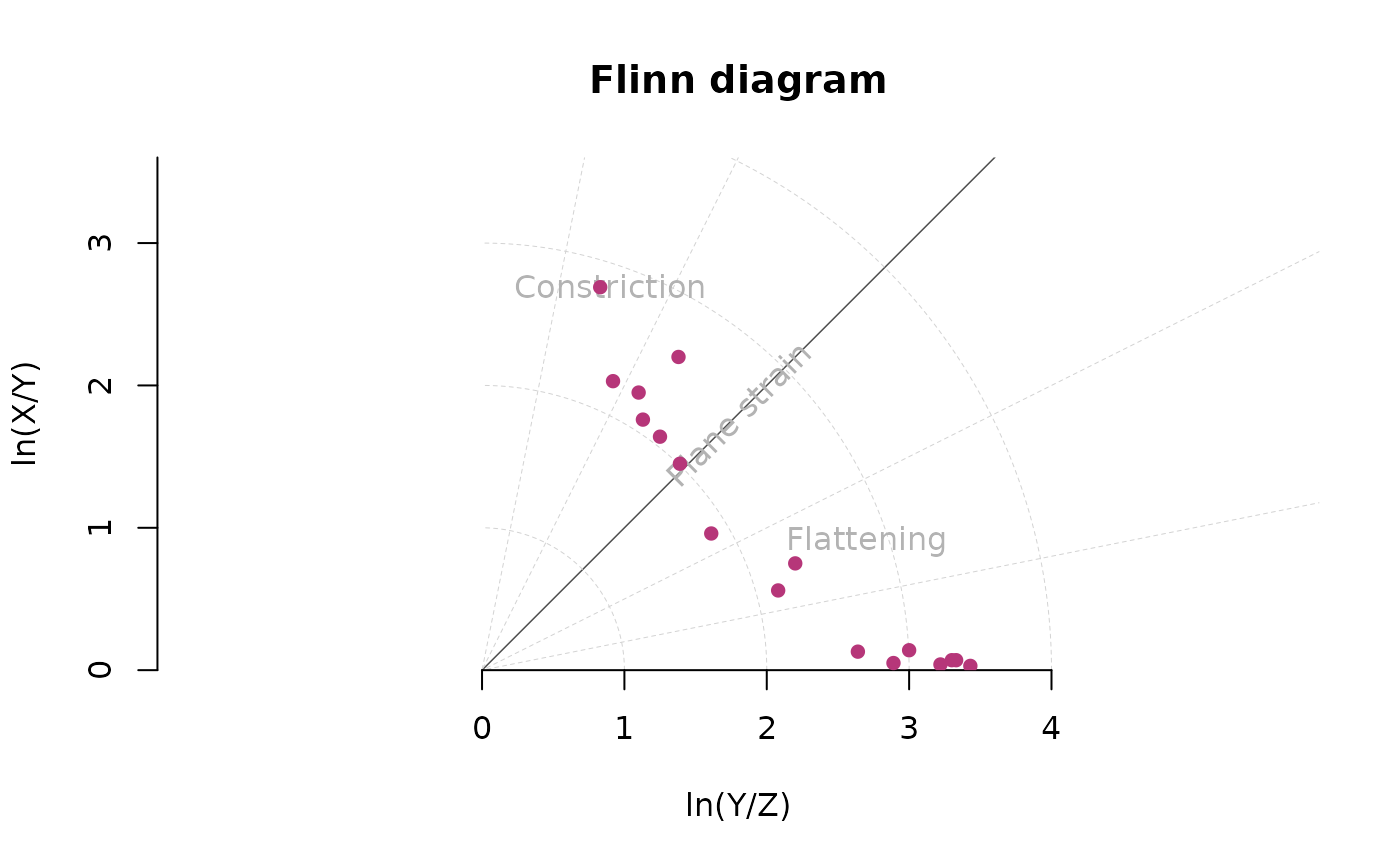
Plots the strain ratios X/Y against Y/Z and shows the strain intensity and the strain symmetry after Flinn (1965)
Usage
flinn_plot(x, ...)

# Default S3 method
flinn_plot(
  x,
  main = "Flinn diagram",
  R.max = NULL,
  log = FALSE,
  add = FALSE,
  guides = NULL,
  ...
)

# S3 method for class 'ortensor'
flinn_plot(x, weights = NULL, ...)

# S3 method for class 'ellipsoid'
flinn_plot(x, ...)

# S3 method for class 'spherical'
flinn_plot(x, weights = NULL, ...)

# S3 method for class 'list'
flinn_plot(x, ...)
Arguments
- x
accepts the following objects: a two-column matrix where first column is the ratio of maximum strain and intermediate strain (X/Y) and second column is the the ratio of intermediate strain and minimum strain (Y/Z); objects of class
"Vec3","Line","Ray","Plane","ortensor"and"ellipsoid"objects. Tensor objects can also be lists of such objects ("ortensor"and"ellipsoid").- ...
plotting arguments passed to
graphics::points()- main
character. The main title (on top).
- R.max
numeric. Maximum aspect ratio for scaling.
- log
logical. Whether the axes should be in logarithmic scale.
- add
logical. Should data be plotted to an existing plot?
- guides
logical. Whether guides should be added to the plot. Defaults to
getOption("structr.guides").- weights
numeric. Weightings
Details
Strain symmetry (Flinn 1965): $$k = \frac{s_1/s_2 - 1}{s_2/s_3 - 1}$$ where \(s_1 \geq s_2 \geq s_3\) the semi-axis lengths of the ellipsoid. The value ranges from 0 to \(\infty\), and is 0 for oblate ellipsoids (flattening), 1 for plane strain and \(\infty\) for prolate ellipsoids (constriction).
and strain intensity (Flinn 1965): $$d = \sqrt{(s_1/s_2 - 1)^2 + (s_2/s_3 - 1)^2}$$
References
Flinn, D. (1965). On the Symmetry Principle and the Deformation Ellipsoid. Geological Magazine, 102(1), 36–45. doi:10.1017/S0016756800053851
See also
ellipsoid() class, ortensor() class, flinn() for Flinn's
strain parameters.
Other fabric-plot:
hsu_plot(),
vollmer-plot,
woodcock_plot()
Examples
data(holst)
R_XY <- holst[, "R_XY"]
R_YZ <- holst[, "R_YZ"]
flinn_plot(cbind(R_XY, R_YZ), log = FALSE, col = "#B63679", pch = 16)
 flinn_plot(cbind(R_XY, R_YZ), log = TRUE, col = "#B63679", pch = 16, type = "b")
 # ellipsoid objects
hossack_ell <- lapply(seq.int(nrow(hossack1968)), function(i) {
ellipsoid_from_stretch(hossack1968[i, 3], hossack1968[i, 2], hossack1968[i, 1])
})
flinn_plot(hossack_ell, col = "#B63679", pch = 16, log = TRUE)
# ellipsoid objects
hossack_ell <- lapply(seq.int(nrow(hossack1968)), function(i) {
ellipsoid_from_stretch(hossack1968[i, 3], hossack1968[i, 2], hossack1968[i, 1])
})
flinn_plot(hossack_ell, col = "#B63679", pch = 16, log = TRUE)
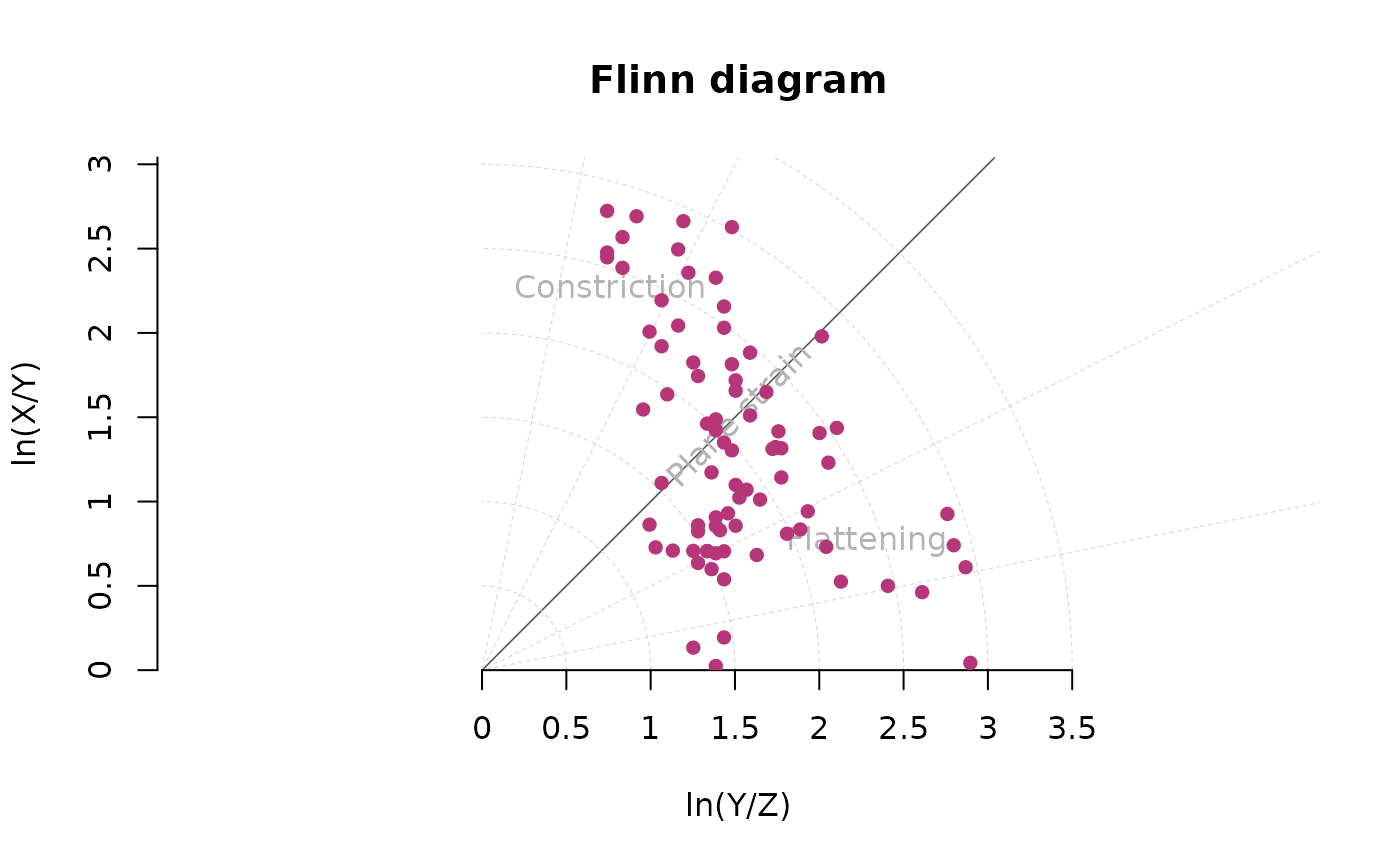 set.seed(20250411)
mu <- Line(120, 50)
x <- rvmf(100, mu = mu, k = 1)
flinn_plot(x, R.max = 2)
set.seed(20250411)
y <- rvmf(100, mu = mu, k = 20)
flinn_plot(ortensor(y), col = "red", R.max = 2, add = TRUE)
set.seed(20250411)
mu <- Line(120, 50)
x <- rvmf(100, mu = mu, k = 1)
flinn_plot(x, R.max = 2)
set.seed(20250411)
y <- rvmf(100, mu = mu, k = 20)
flinn_plot(ortensor(y), col = "red", R.max = 2, add = TRUE)