Creates a fabric plot using the eigenvalue method
Usage
vollmer_plot(x, ...)

# Default S3 method
vollmer_plot(
  x,
  labels = NULL,
  add = FALSE,
  ngrid = c(5, 5, 5),
  main = "Vollmer diagram",
  guides = NULL,
  ...
)

# S3 method for class 'spherical'
vollmer_plot(
  x,
  labels = NULL,
  add = FALSE,
  ngrid = c(5, 5, 5),
  main = "Vollmer diagram",
  weights = NULL,
  guides = NULL,
  ...
)

# S3 method for class 'list'
vollmer_plot(
  x,
  labels = NULL,
  add = FALSE,
  ngrid = c(5, 5, 5),
  main = "Vollmer diagram",
  guides = NULL,
  ...
)
Arguments
- x
spherical object or a three-column matrix, where the first column is P, the second is G, and the third one is R of the Vollmer parameters.
- ...
optional graphical parameters
- labels
character. text labels
- add
logical. Should data be plotted to an existing plot?
- ngrid
integer or 3-element vector specifying the amount of gridlines for the P, G, and G axes. Constant grid spacing when only one integer is given.
NULLwhen no grid.- main
character. The main title for the plot.
- guides
logical. Whether guides should be added to the plot. Defaults to
getOption("structr.guides").- weights
numeric. Weightings
References
Vollmer, F. W. (1990). An application of eigenvalue methods to structural domain analysis. Geological Society of America Bulletin, 102, 786<U+2013>791.
See also
Other fabric-plot:
flinn_plot(),
hsu_plot(),
woodcock_plot()
Examples
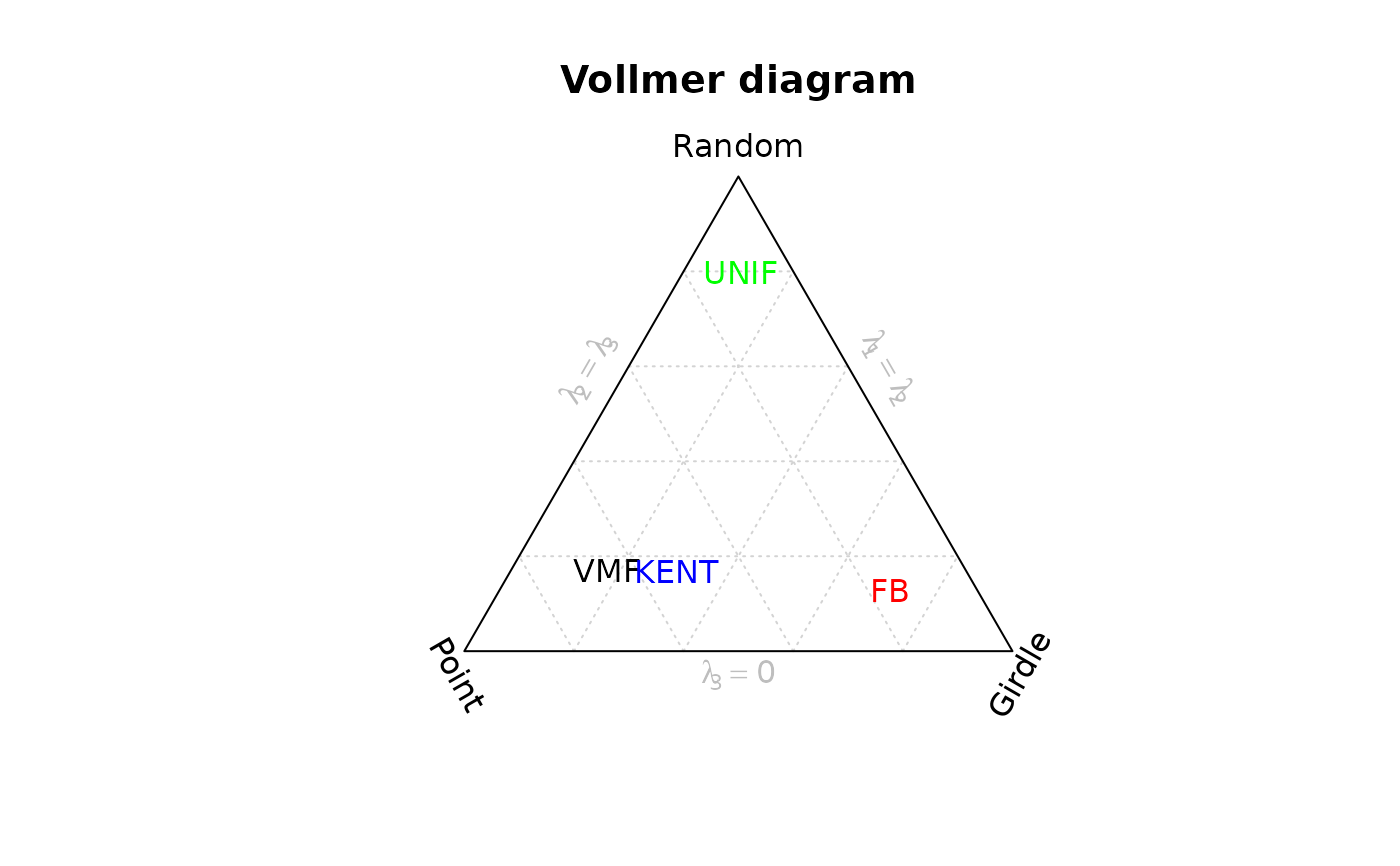
# Orientation data
set.seed(20250411)
mu <- Line(120, 50)
a <- rvmf(10, mu = mu, k = 10)
vollmer_plot(a, labels = "VMF")

b <- rfb(100, mu = mu, k = 1, A = diag(c(10, 0, 0)))
vollmer_plot(b, labels = "FB", add = TRUE, col = "red")

c <- runif.spherical(n = 100, "Line", method = "rotasym")
vollmer_plot(c, labels = "UNIF", add = TRUE, col = "green")

d <- rkent(100, mu = mu, k = 10, b = 4)
vollmer_plot(d, labels = "KENT", add = TRUE, col = "blue")