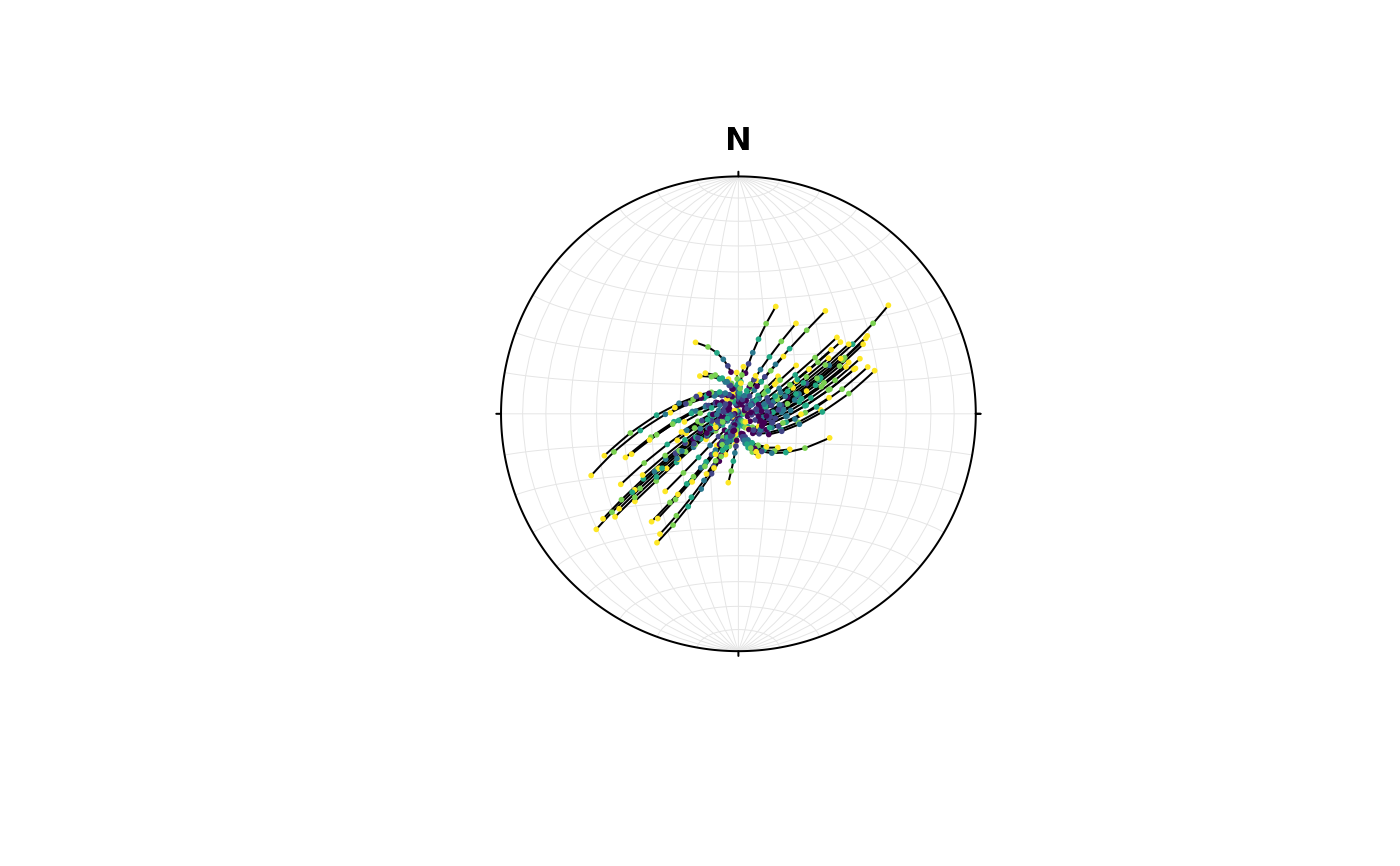
Plot the paths of deformed vectors in a equal-area or stereographic projection
Usage
stereo_path(
  x,
  type = c("l", "p", "b"),
  add = TRUE,
  n = 5L,
  upper.hem = NULL,
  earea = NULL,
  ...
)
Arguments
- x
list of spherical objects.
- type
character. Type of plotting the path.
"l"if only the path line should be shown,"p"if only the vectors should be shown, and"b"if both should be plotted.- add
logical. Whether the paths should be added to a existing plot or a new one should be created?
- n
integer. Number of points to be interpolated
- upper.hem
logical. Whether the projection is shown for upper hemisphere (
TRUE) or lower hemisphere (FALSE). Defaults togetOption("structr.upper.hem").- earea
logical. Projection, either
TRUEfor Lambert equal-area projection, orFALSEfor meridional stereographic projection. Defaults togetOption("structr.earea").- ...
parameters passed to
stereo_point(),stereo_smallcircle(),stereo_greatcircle(), orfault_plot()
Examples
d <- defgrad_from_generalshear(k = 2.5, gamma = 0.9)
v <- velgrad(d, time = 10)
d_steps <- defgrad(v, time = 10, steps = 2)

# apply on orientation data
set.seed(20250411)
l <- rvmf(100, mu = Line(0, 90), k = 100)
l_trans <- lapply(d_steps, function(i) {
  transform_linear(l, i)
})

# plot in stereonet
axes <- Vec3(c(1, 0, 0), c(0, 1, 0), c(0, 0, 1))
stereo_path(l_trans, type = "l", add = FALSE)
stereo_path(l_trans, type = "p", col = assign_col(seq_along(l_trans)), pch = 16, cex = .4)