
Polyphase Stress Inversion via Spectral Clustering on \(S^5\) (Stage 5).
Source:R/stress_inversion_wissi.R
slip_inversion_wissi_polyphase.RdIdentifies k stress phases automatically using the eigengap heuristic,
then runs slip_inversion_wissi() on each phase subset.
Usage
slip_inversion_wissi_polyphase(
  x,
  weights = NULL,
  k_max = 4L,
  sigma_K_deg = 30,
  seed = NULL,
  ...
)
Arguments
- x
"Fault"object where the rows are the observations, and the columns the coordinates. Object must be complete, i.e. noNAvalues. For Michael's, Angelier's, and Yamaji-Sato's methods, at least 4 rows of fault measurements are required, while Hansen's method requires at least 7.- weights
Optional length-
Nnumeric vector of non-negative data quality weights.NAvalues are replaced with the observed mean before scaling (neutral imputation). The vector is normalised internally so thatmean(weights) = 1, meaning only the ratios between weights matter. Usescale_weights()to construct weights from field quality ranks, measurement errors, and prior RUP values. Default: uniform weights.- k_max
Maximum number of phases to consider. Default
4.- sigma_K_deg
Affinity bandwidth in degrees of angular stress distance. Faults within this distance are considered similar. Default
30.Increase to merge nearby phases, decrease to split them.- seed
Optional RNG seed for k-means reproducibility.
- ...
Additional arguments passed to
slip_inversion_wissi()for each phase.
Value
A named list with:
assignmentinteger vector of length N (phase label 1..k per fault)
k_optnumber of phases identified
gapsLaplacian eigenvalue gaps (eigengap criterion)
phase_resultslist of
kslip_inversion_wissi()results, one per phaseD_matN x N pairwise ASD matrix between fault poles (degrees)
See also
Other wissi:
slip_inversion_wissi(),
slip_inversion_wissi_boot()
Examples
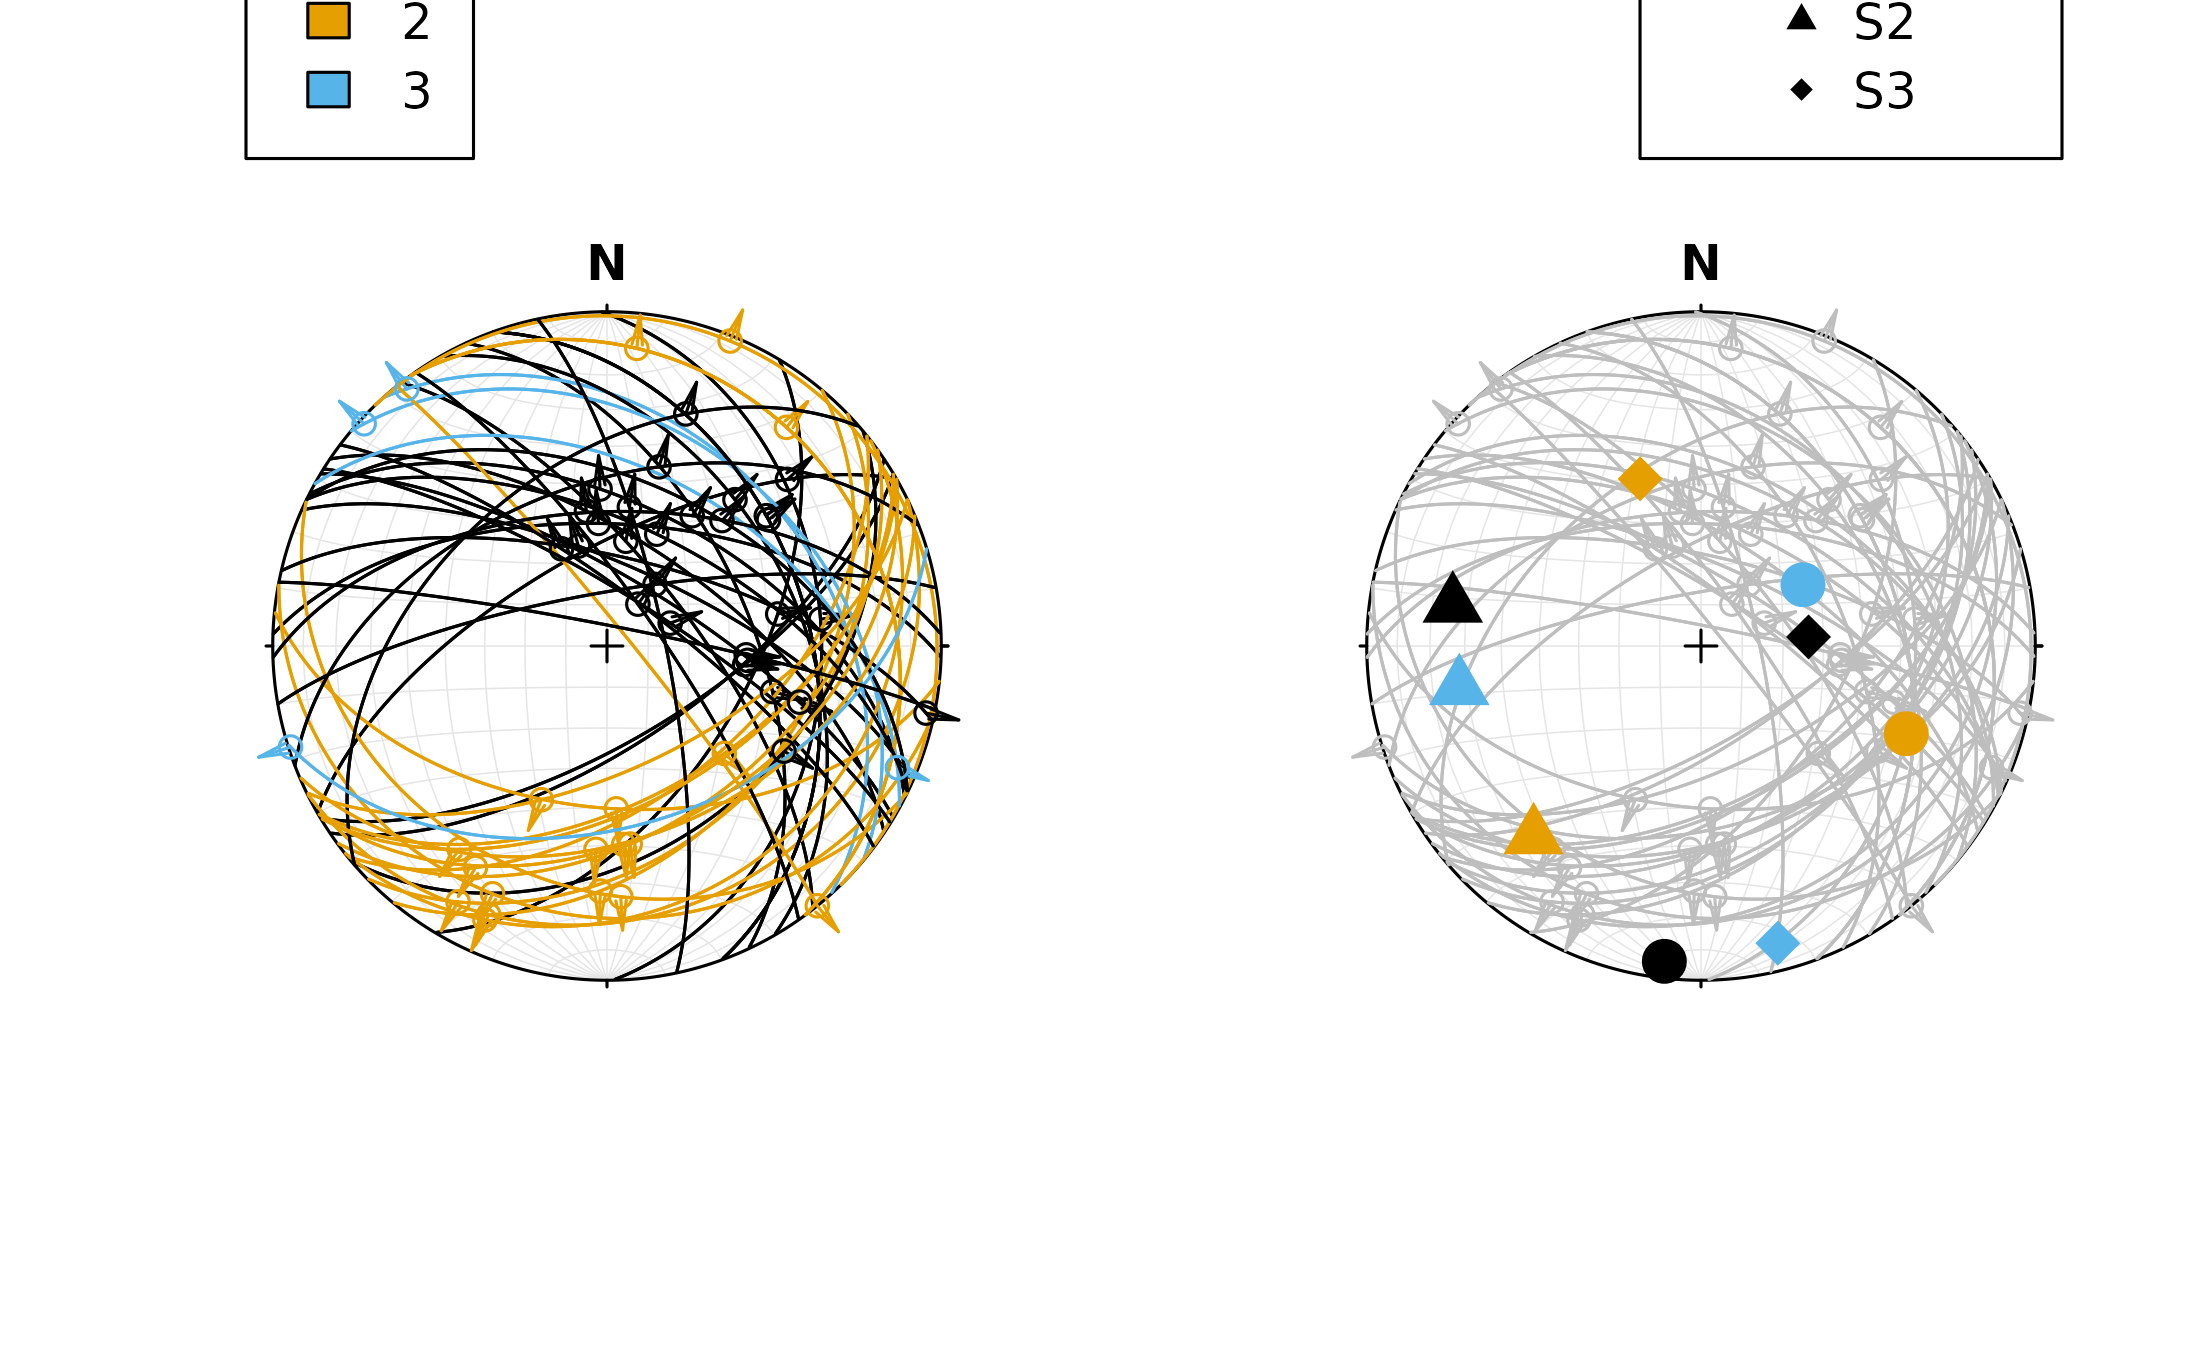
res <- slip_inversion_wissi_polyphase(angelier1990$KAM, sigma_K_deg = 15)
# check amount of clusters detected
res$k_opt
#> [1] 3
# plot the results in lambert projection:
cols <- assign_col_d(seq_len(res$k_opt))#'
par(mfrow = c(1, 2))
stereoplot()
angelier(angelier1990$KAM, col = assign_col_d(res$assignment))
legend('topleft', title = 'Phases', fill = cols, legend = 1:3)
stereoplot()
angelier(angelier1990$KAM, col = 'grey')
for(k in seq_len(res$k_opt)){
res_k <- res$phase_results[[k]]
points(res_k$principal_axes, col = cols[k], pch = 16:18, cex = 2)
}
legend('topright', title = "Principal axes", pch = 16:18, col = 'black',
legend = c('S1', 'S2', 'S3'))
 dev.off()
#> null device
#> 1
dev.off()
#> null device
#> 1