Principal component (geodesic) analysis in the tangent space.
Usage
# S3 method for class 'Vec3'
prcomp(x, center = geodesic_mean(x), n = 0L)

# S3 method for class 'Ray'
prcomp(x, center = geodesic_mean(x), n = 0L)

# S3 method for class 'Line'
prcomp(x, center = geodesic_mean(x), n = 0L)

# S3 method for class 'Plane'
prcomp(x, center = geodesic_mean(x), n = 0L)

# S3 method for class 'Pair'
prcomp(x, center = geodesic_mean(x), n = 0L, group = NULL)
Arguments
- x
object of class
"Vec3","Line","Ray","Plane","Pair", or"Fault", where the rows are the observations and the columns are the coordinates.- center
A spherical object. Typically the geodesic mean of
x.- n
real number (integer, 0 or >= 3). The number of points to return on each of the four geodesics through the center.
- group
Symmetry group of
x. Seesymmetry_group()for details IfNULL, the group will be automatically picked based on the class ofx.
Value
A list consisting of
rotation3x3 rotation matrix
magnitudes2D real vector, non-negative. Magnitudes are analogous to sample standard deviations. They are in decreasing order and quantify how dispersed the data are in those two directions.
directions2x2 real matrix, whose columns are unit-length vectors. The corresponding directions to the magnitudes
pcsFromRayfunction to convert rays to 2-dimensional vectors
rayFromPCsfunction to convert 2-dimensional vectors to rays
curveslist of two lists of (2
n+ 1) rays, only ifn>= 1tangentsTangents from
directionsandrotation
If x is a "Pair" object the list only contains magnitudes, directions
and curves (if n>=1).
Examples
# Line data
res <- prcomp(example_lines, n = 10)
stereoplot(sub = paste("SD1:", round(res$magnitudes[1], 2), "| SD2:",
round(res$magnitudes[2], 2)), guides = FALSE)
points(example_lines, pch = 16, cex = .8, col = 'gray')
invisible(lapply(res$curves, stereo_lines, col = "red", lwd = 1.5))
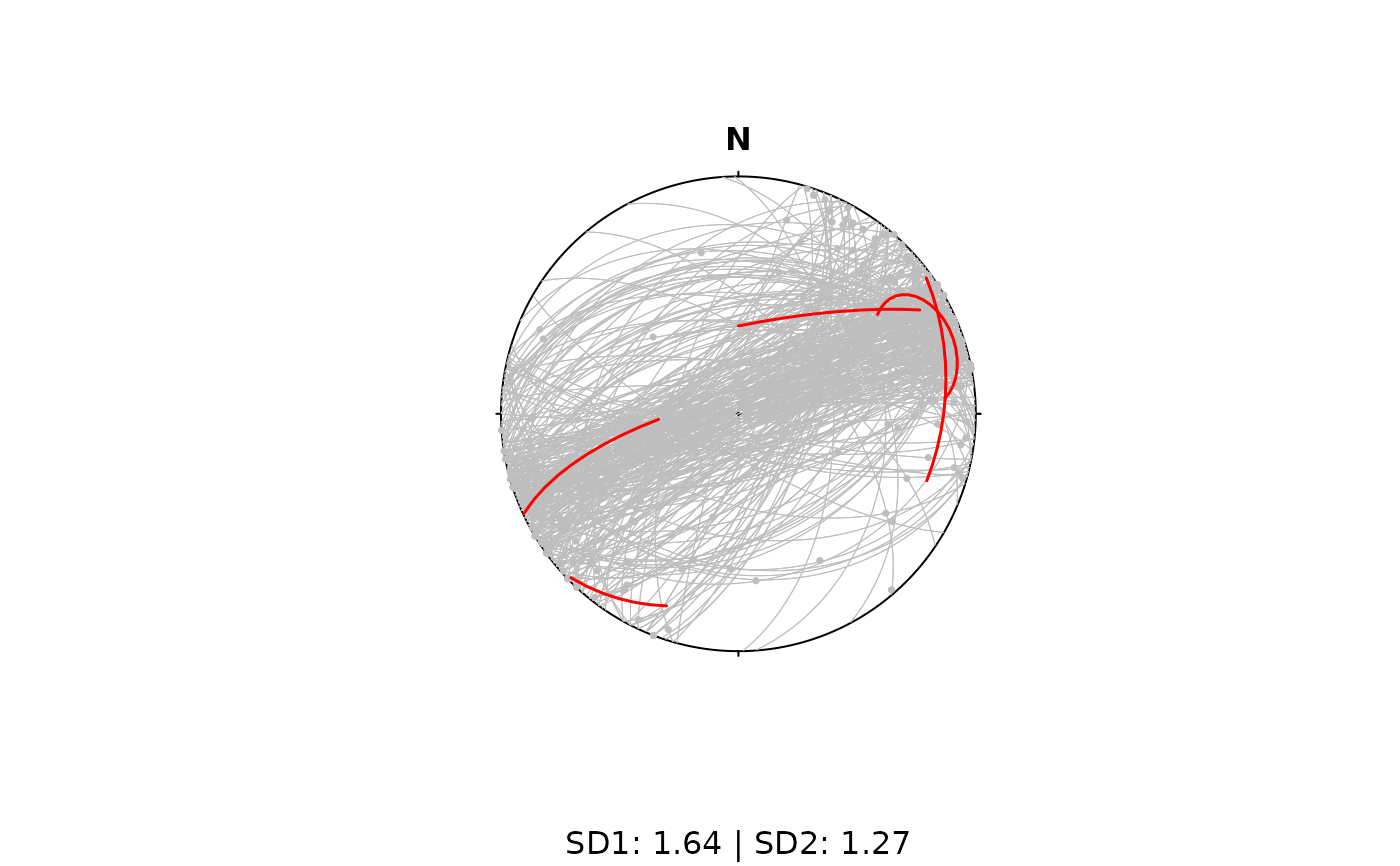
 # Pair data
p <- Pair(strabo_prj$planar, strabo_prj$linear)
res2 <- prcomp(p, n = 10)
stereoplot(sub = paste("SD1:", round(res2$magnitudes[1], 2), "| SD2:",
round(res2$magnitudes[2], 2)), guides=FALSE)
stereo_pair(p, pch = 16, cex = .5, lwd = 0.5, col = 'gray')
invisible(lapply(res2$curves, stereo_lines, col = "red", lwd = 1.5))
# Pair data
p <- Pair(strabo_prj$planar, strabo_prj$linear)
res2 <- prcomp(p, n = 10)
stereoplot(sub = paste("SD1:", round(res2$magnitudes[1], 2), "| SD2:",
round(res2$magnitudes[2], 2)), guides=FALSE)
stereo_pair(p, pch = 16, cex = .5, lwd = 0.5, col = 'gray')
invisible(lapply(res2$curves, stereo_lines, col = "red", lwd = 1.5))