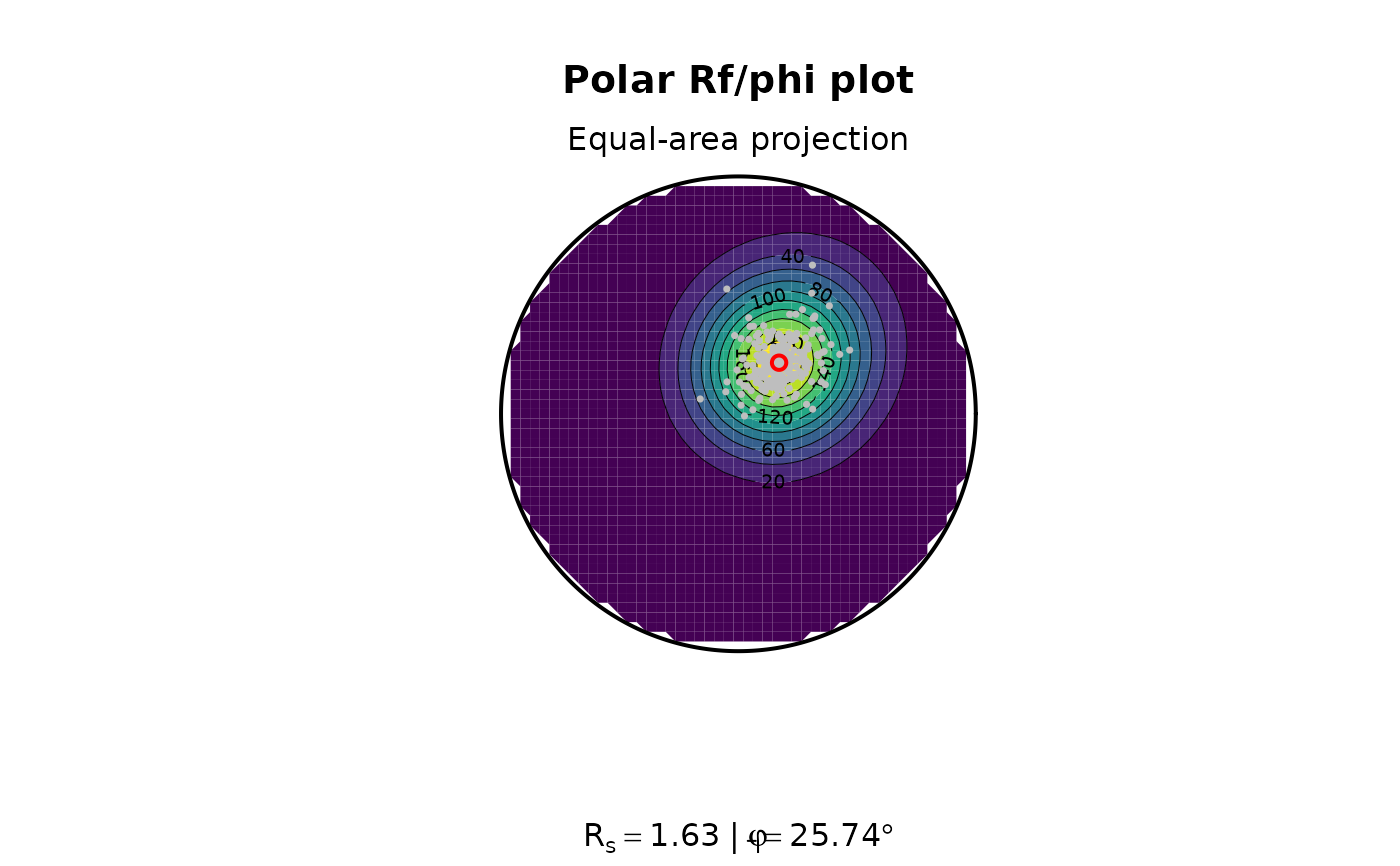
Plots Rf/ϕ plot fabric plot in polar coordinates (after Elliott, 1970).
Usage
Rphi_polar_plot(
  r,
  phi,
  proj = c("eqd", "eqa", "stg", "ort", "gno", "lin", "rdl"),
  contour = TRUE,
  image = FALSE,
  n = 10L,
  contour.lines = TRUE,
  contour.lines.params = list(lwd = 0.5, col = par("col")),
  contour.col = viridis,
  contour.col.params = list(),
  mean.ellipse = TRUE,
  mean.ellipse.params = list(col = "red", lwd = 2),
  point.params = list(col = "grey", pch = 16, cex = 0.5),
  main = "Polar Rf/phi plot",
  ...
)

elliott_plot(
  r,
  phi,
  proj = c("eqd", "eqa", "stg", "ort", "gno", "lin", "rdl"),
  contour = TRUE,
  image = FALSE,
  n = 10L,
  contour.lines = TRUE,
  contour.lines.params = list(lwd = 0.5, col = par("col")),
  contour.col = viridis,
  contour.col.params = list(),
  mean.ellipse = TRUE,
  mean.ellipse.params = list(col = "red", lwd = 2),
  point.params = list(col = "grey", pch = 16, cex = 0.5),
  main = "Polar Rf/phi plot",
  ...
)
Arguments
- r
numeric. Aspect ratio of deformed object (long axis / short axis)
- phi
numeric. Orientation of long axis of deformed object (in degrees)
- proj
character.
- contour
logical. Whether a grid of densities should be drawn in the background.
- image
logical. Whether a raster image or filled contour lines should be drawn as density grid. Ignored when
contour=FALSE- n
integer. Grid resolution or number of filled contours
- contour.lines
logical. Whether contour lines should be added.
- contour.lines.params
list of plotting arguments passed to
graphics::contour()- contour.col
function to produce color palette used for contouring
- contour.col.params
list of plotting arguments passed
col.palette- mean.ellipse
logical. Whether the mean ellipse should be plotted
- mean.ellipse.params
list of plotting arguments passed to
ellipse()- point.params
list of plotting arguments passed to
graphics::points()- main
character. The main title (on top).
- ...
optional arguments passed to
hypercontour()
Note
Rphi_plot() and elliot_plot() are identical.
References
Elliott, D. (1970). Determination of Finite Strain and Initial Shape from Deformed Elliptical Objects. GSA Bulletin, 81(8), 2221–2236.