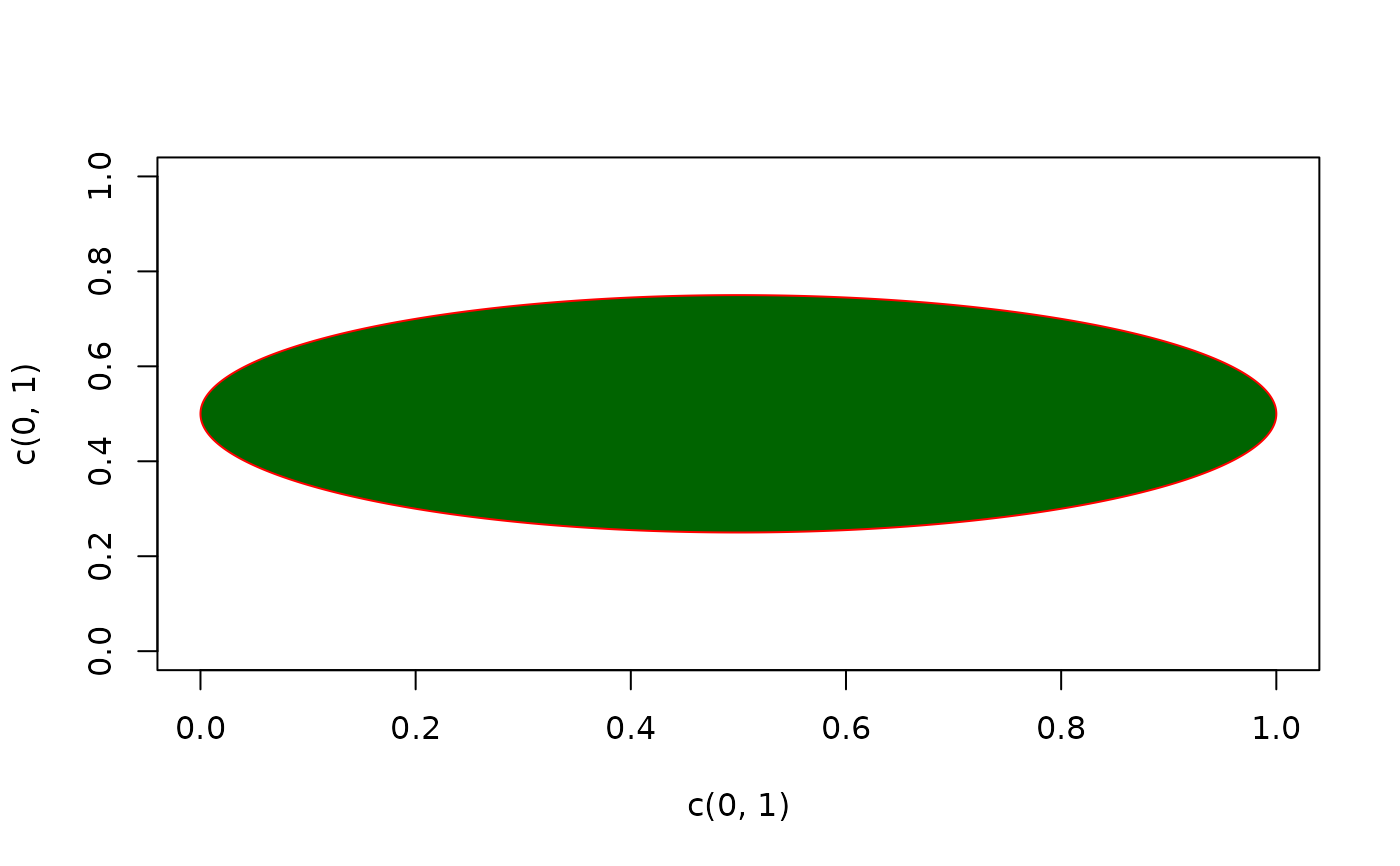
Add an Ellipse to existing plot
Arguments
- x, y
the x and y co-ordinates for the center(s) of the ellipse(s).
- radius.x
scalar or a vector giving the semi-major axis of the ellipse.
- radius.y
a scalar or a vector giving the semi-minor axis of the ellipse.
- rot
angle of rotation in radians.
- nv
number of vertices to draw the ellipses.
- border
color for borders. The default is par("fg"). Use border = NA to omit borders.
- col
color(s) to fill or shade the annulus sector with. The default NA (or also NULL) means do not fill (say draw transparent).
- lty
line type for borders and shading; defaults to "solid".
- lwd
line width for borders and shading.
- plot
logical. If TRUE the structure will be plotted. If FALSE only the points are calculated and returned. Use this if you want to combine several geometric structures to a single polygon.