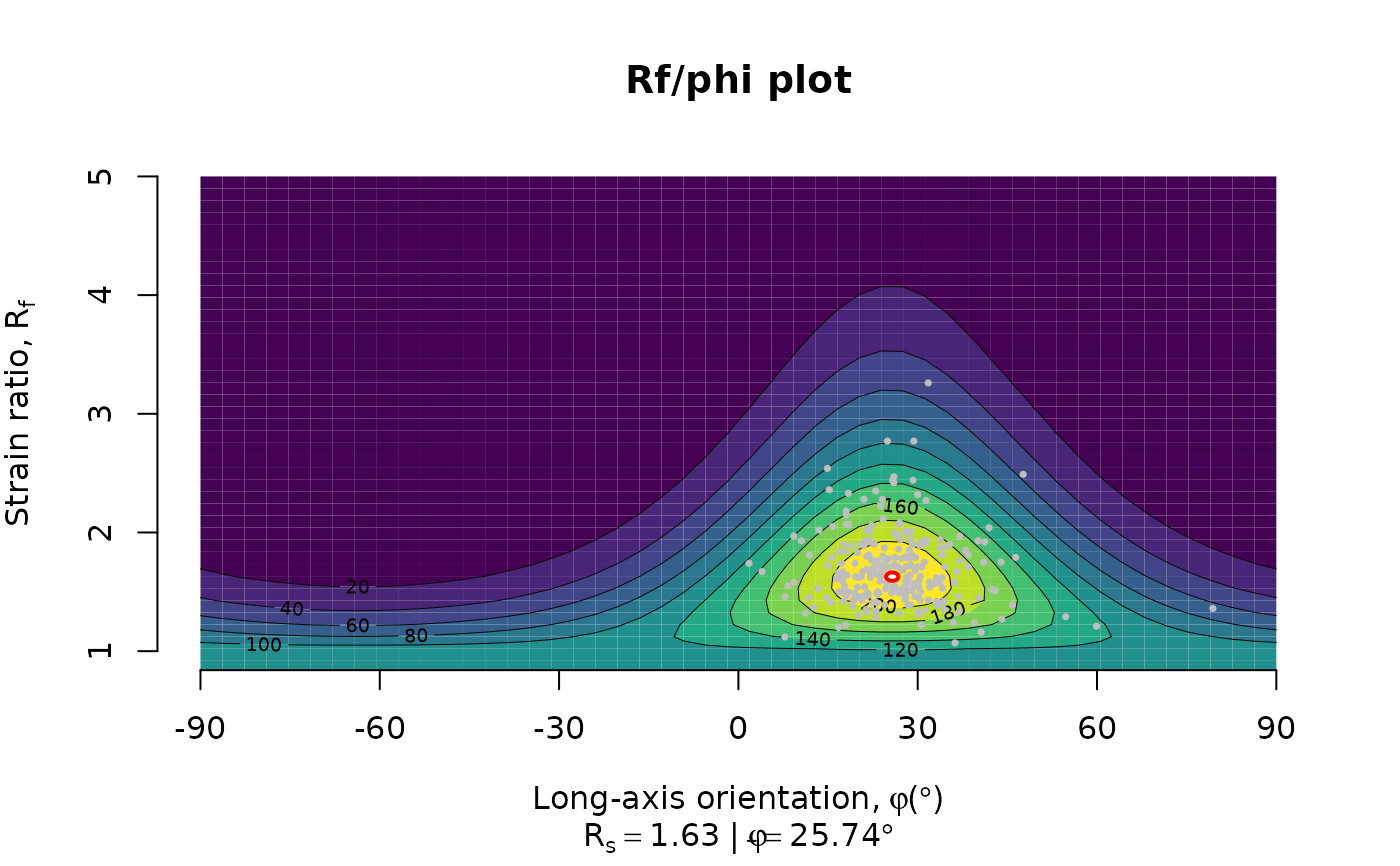
Plot finite strain ellipse against orientation of finite stretching axes (after Ramsay, 1983)
Usage
Rphi_plot(
  r,
  phi,
  contour = TRUE,
  image = FALSE,
  n = 10L,
  contour.lines = TRUE,
  contour.lines.params = list(lwd = 0.5, col = par("col")),
  contour.col = viridis,
  contour.col.params = list(),
  mean.ellipse = TRUE,
  mean.ellipse.method = "eigen",
  mean.ellipse.params = list(border = "red", lwd = 2),
  point.params = list(col = "grey", pch = 16, cex = 0.5),
  rmax = NULL,
  at.x = seq(-90, 90, 30),
  at.y = NULL,
  main = "Rf/phi plot",
  ...
)
Arguments
- r
numeric. Aspect ratio of deformed object (long axis / short axis)
- phi
numeric. Orientation of long axis of deformed object (in degrees)
- contour
logical. Whether a grid of densities should be drawn in the background.
- image
logical. Whether a raster image or filled contour lines should be drawn as density grid. Ignored when
contour=FALSE- n
integer. Grid resolution or number of filled contours
- contour.lines
logical. Whether contour lines should be added.
- contour.lines.params
list of plotting arguments passed to
graphics::contour()- contour.col
function to produce color palette used for contouring
- contour.col.params
list of plotting arguments passed
col.palette- mean.ellipse
logical. Whether the mean ellipse should be plotted
- mean.ellipse.method
character. Whether the mean ellipse should be determined using the eigenvector method after Shimamoto and Ikeda, 1976 (
"eigen", the default), or Ramsay's method using the geometric mean of min and max Rf values ("ramsay").- mean.ellipse.params
list of plotting arguments passed to
ellipse()- point.params
list of plotting arguments passed to
graphics::points()- rmax
maximum R value (if
NULL, computed automatically)- at.x, at.y
the points at which tick-marks and labels for the x and y axes are to be drawn.
- main
character. The main title (on top).
- ...
optional arguments passed to
hypercontour()
References
Ramsay, J. G., & Huber, M. I. (1983). The Techniques of Modern Structural Geology: Strain Analyses (Vol. 1). London: Academic Press.
Examples
data(ramsay)
Rphi_plot(ramsay[, 1], ramsay[, 2])