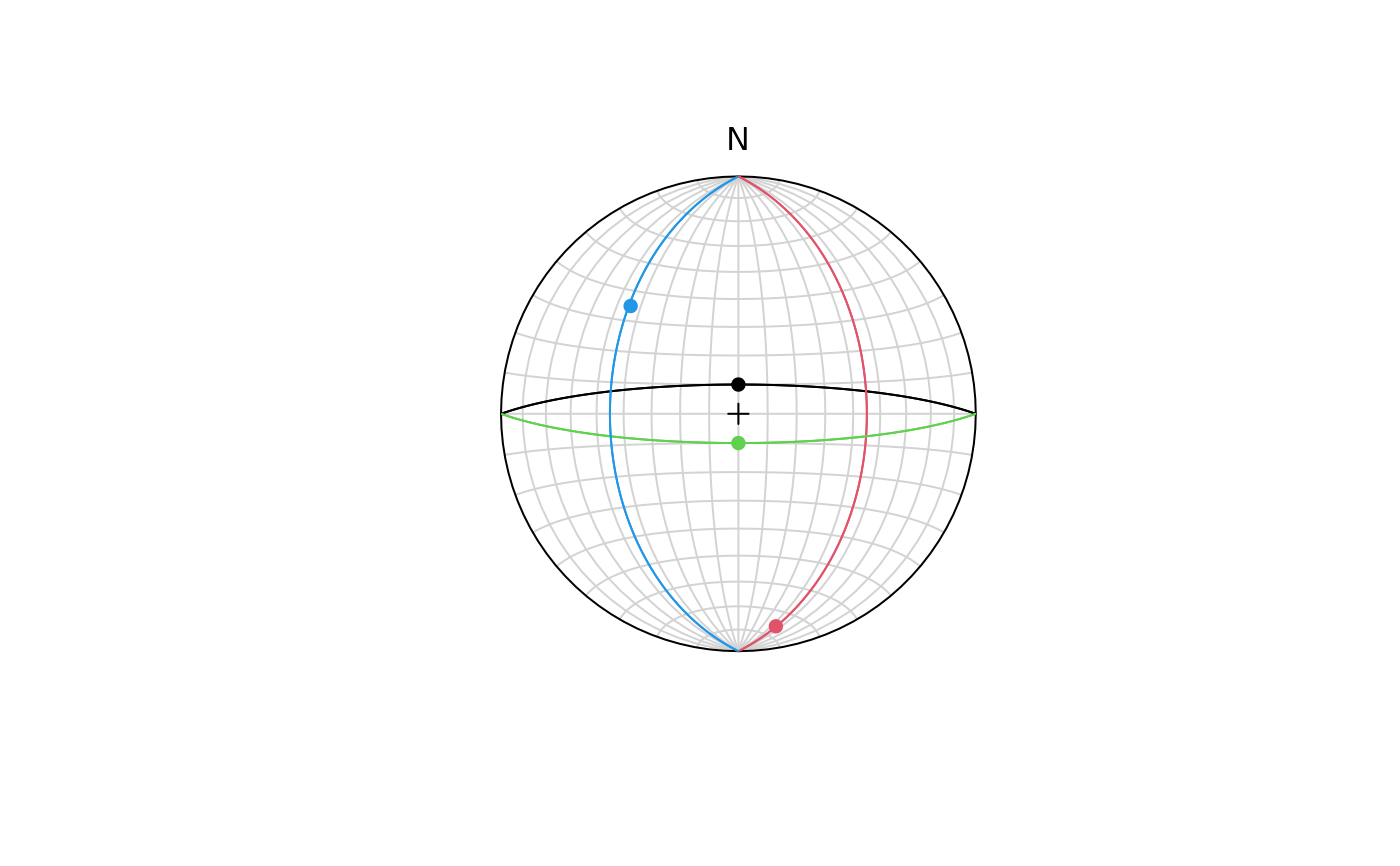
Visualization of pairs (planes and lines) in a stereographic projection.
Usage
stereo_pair(
  x,
  pch = 16,
  col = 1,
  lwd = 1,
  lty = 1,
  lab = NULL,
  cex = 1,
  greatcircles = TRUE,
  upper.hem = NULL,
  earea = NULL
)
Arguments
- x
"Fault"object where the rows are the observations, and the columns the coordinates. Object must be complete, i.e. noNAvalues. For Michael's, Angelier's, and Yamaji-Sato's methods, at least 4 rows of fault measurements are required, while Hansen's method requires at least 7.- pch, col, lwd, lty
plotting parameters for planes and lines
- lab
character. text labels
- cex
character expansion of labels
- greatcircles
logical. Whether greatcircles are displayed (
TRUE, the default) or poles to planes (FALSE)- upper.hem
logical. Whether the projection is shown for upper hemisphere (
TRUE) or lower hemisphere (FALSE). Defaults togetOption("structr.upper.hem").- earea
logical. Projection, either
TRUEfor Lambert equal-area projection, orFALSEfor meridional stereographic projection. Defaults togetOption("structr.earea").
Examples
faults <- Fault(
  c(0, 90, 180, 270),
  c(80, 45, 80, 45),
  c(0, 170, 180, 315),
  c(80, 10, 80, 36),
  c(1, -1, 0, 1)
)
# stereoplot()
# stereo_fault(faults, col = 1:4)
# stereo_fault(faults, col =1:4, hoeppener = TRUE)
# legend("bottomright", c("normal", "thrust", "unknown", "normal"), fill = 1:4)

stereoplot()
stereo_pair(faults, col = 1:4)