Plots the Mohr Circle for Strain
Arguments
- lambda1, lambda2, lambda3
numeric. Magnitude of quadratic elongation \(\lambda\)
- phi
numeric. (optional) Angle (in degrees) for a specific strain
- fg, fg12, fg23
border color for the Mohr Circles spanning lambda1-lambda3, lambda1-lambda2, and lambda2-lambda3, respectively
- bg, bg12, bg23
fill color for the Mohr Circles spanning lambda1-lambda3, lambda1-lambda2, and lambda2-lambda3, respectively
- axes
logical. Show axes of plot?
- col
color for the stress state for a given
phi.- full.circle
logical. Should the complete Mohr circle be shown, or only the upper (positive shear stress) part of the circle?
- include.zero
logical. the plot range be extended to include
lambda = 0?- xlim, ylim
range of plot
- round
integer indicating the number of decimal places to be used for rounding.
- ...
optional graphical parameters.
See also
Mohr_plot() for Stress. strain for converting strain quantities
Examples
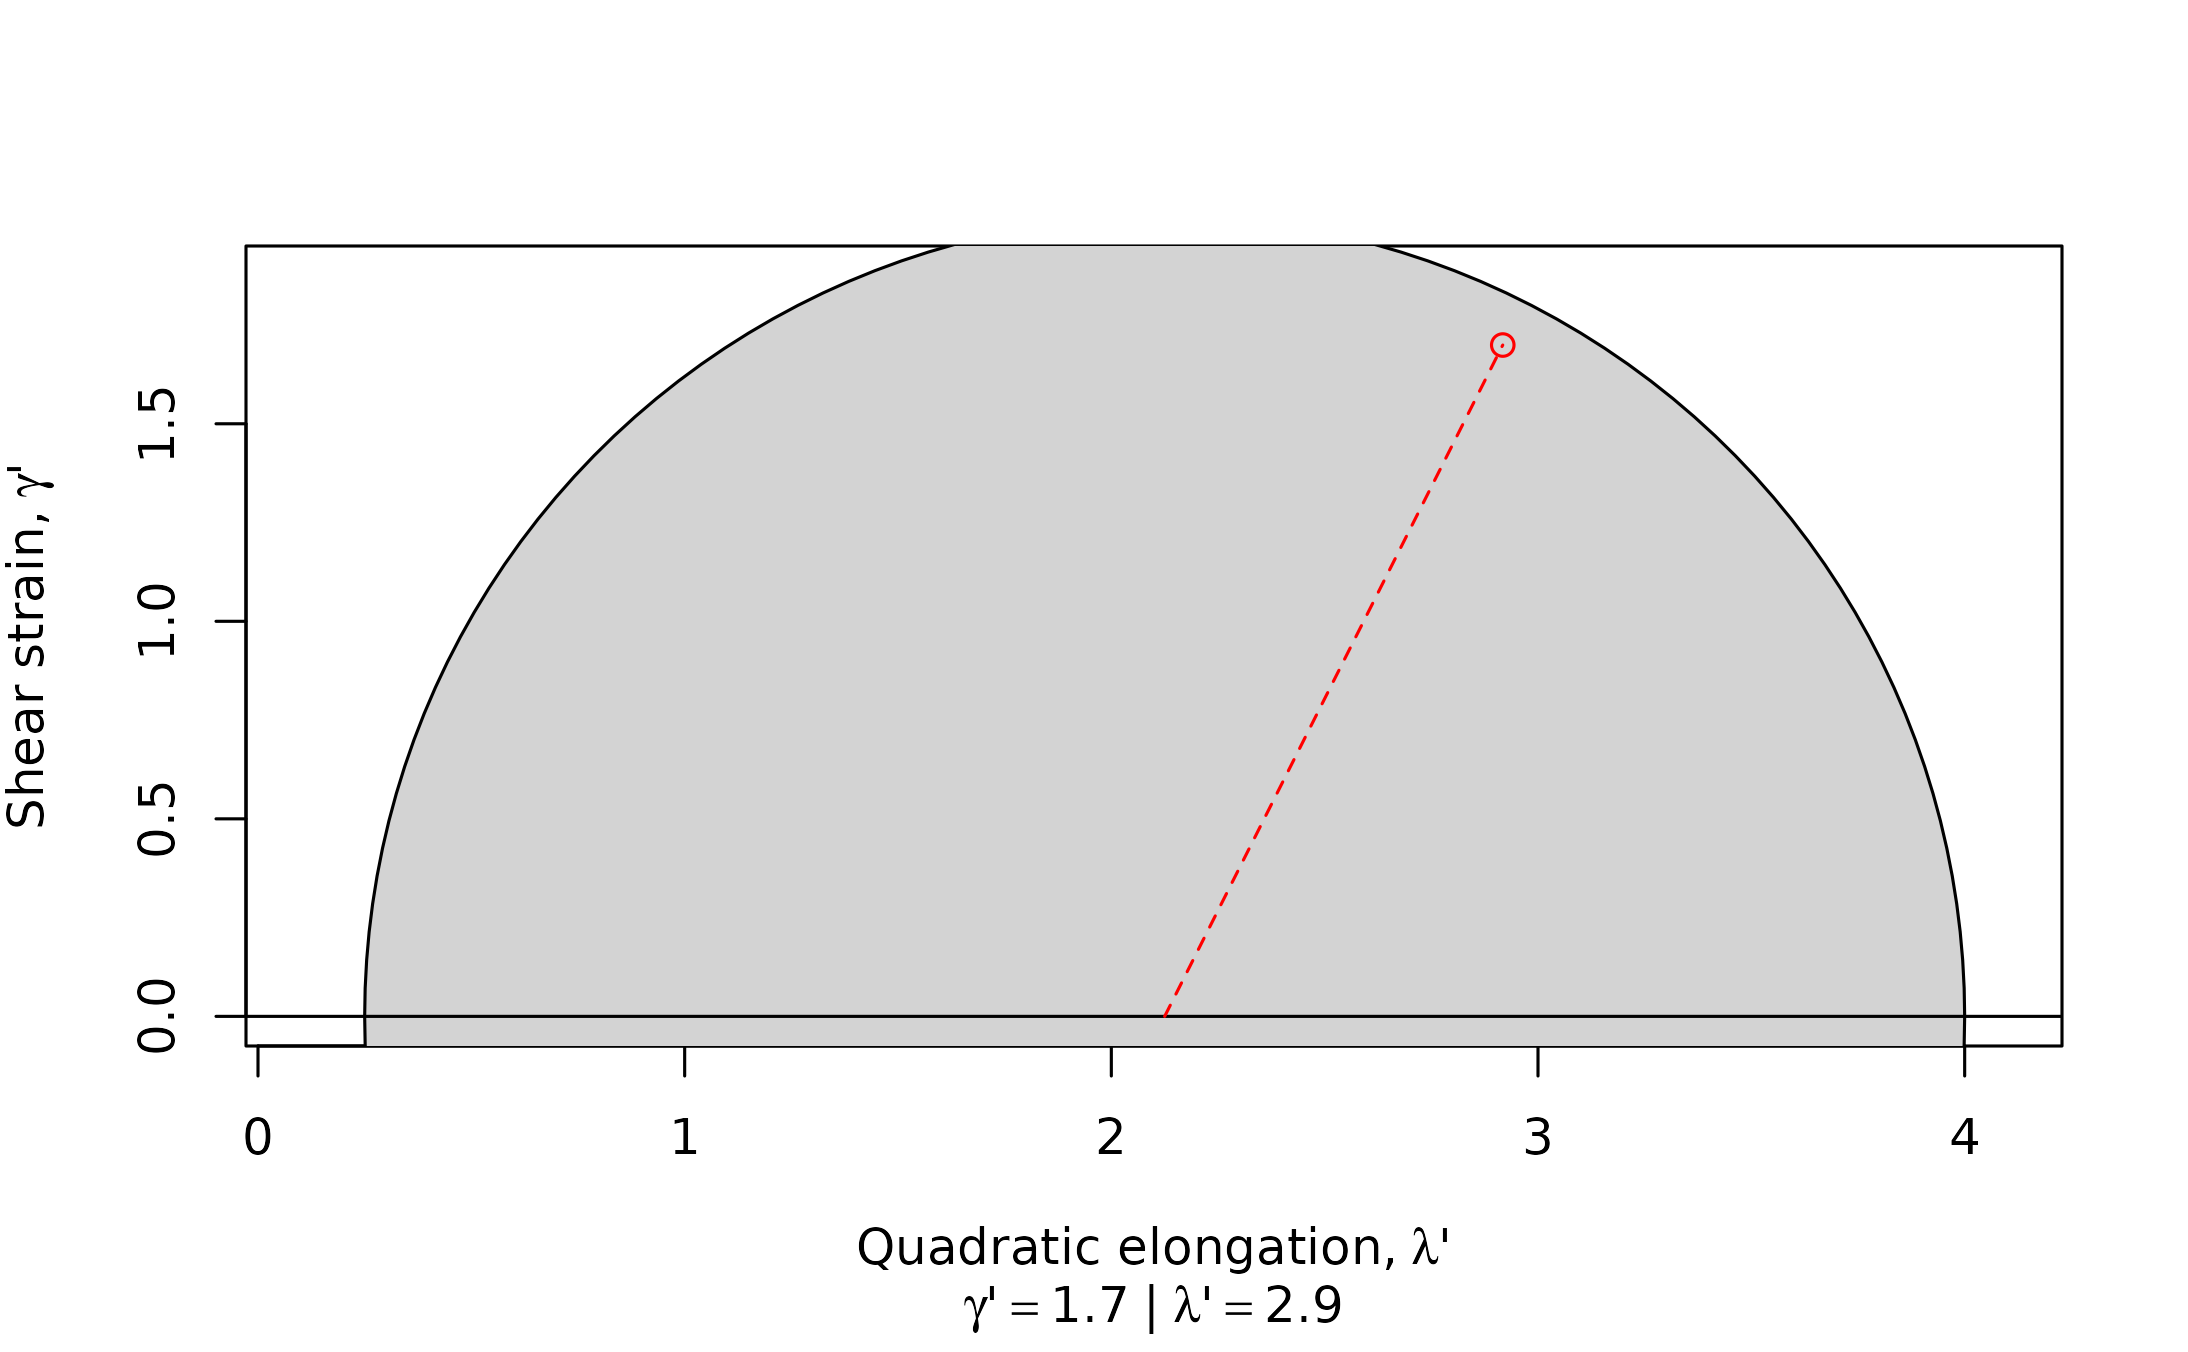
Mohr_strain(lambda1 = 4, lambda3 = 0.25, phi = 25, col = 'red')
 (Mohr_strain(lambda1 = 4, lambda2 = 1, lambda3 = 0.25, phi = c(0, 25, 50, 45), col = 'red', full.circle = TRUE, axes = FALSE))
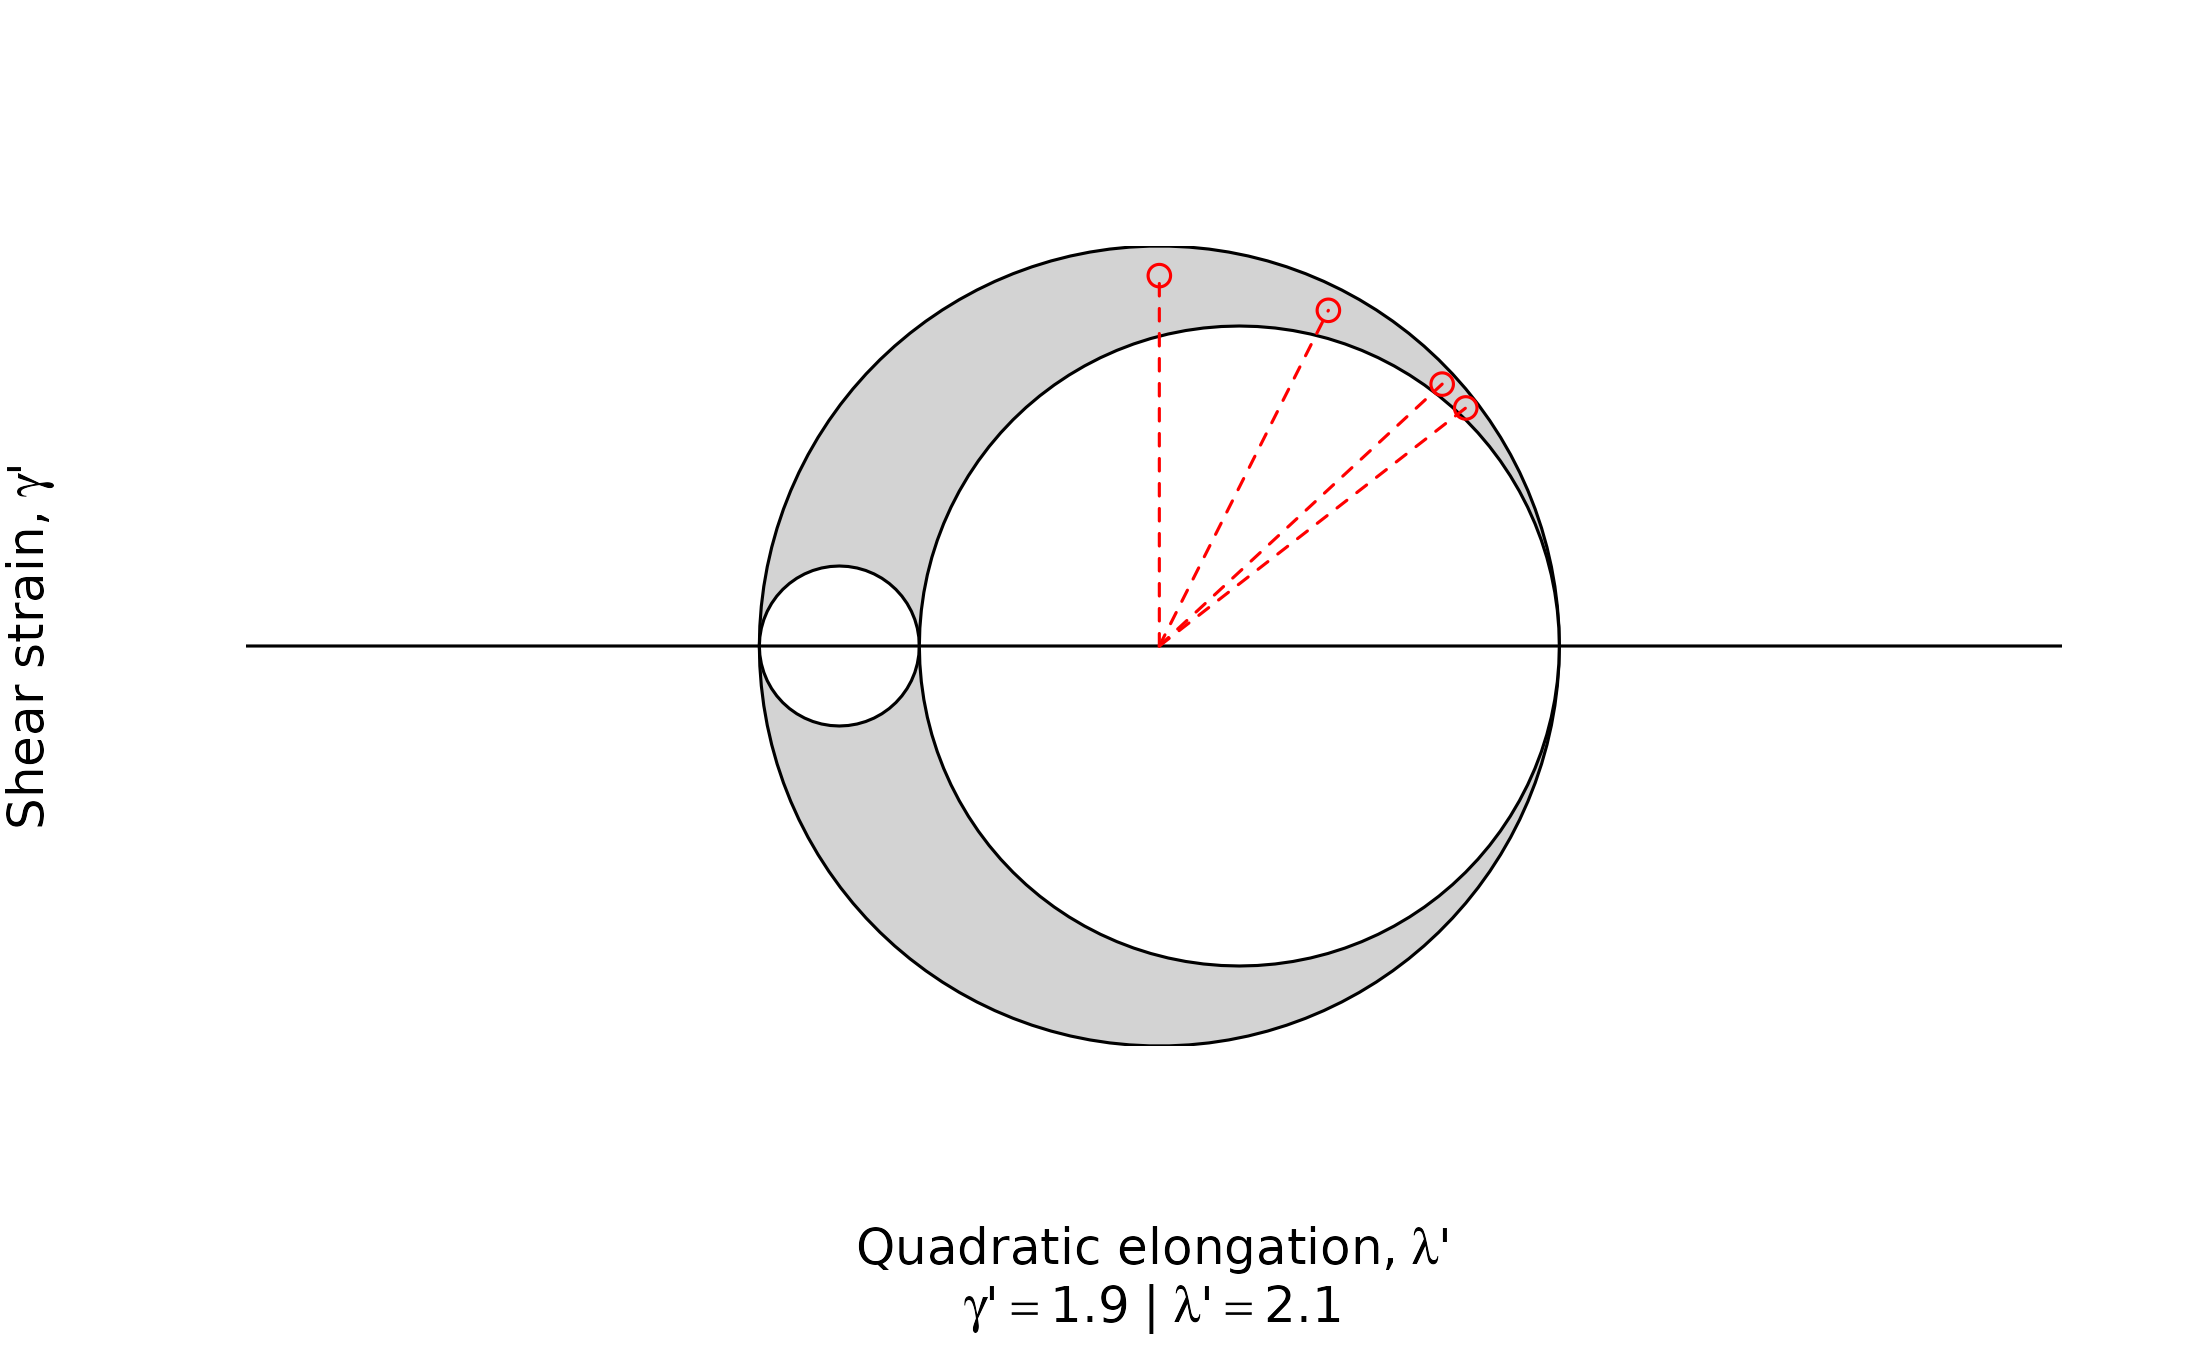 #> lambda_i gamma_i
#> [1,] 2.125000 1.875000
#> [2,] 2.917409 1.699327
#> [3,] 3.561333 1.205227
#> [4,] 3.450825 1.325825
#> lambda_i gamma_i
#> [1,] 2.125000 1.875000
#> [2,] 2.917409 1.699327
#> [3,] 3.561333 1.205227
#> [4,] 3.450825 1.325825