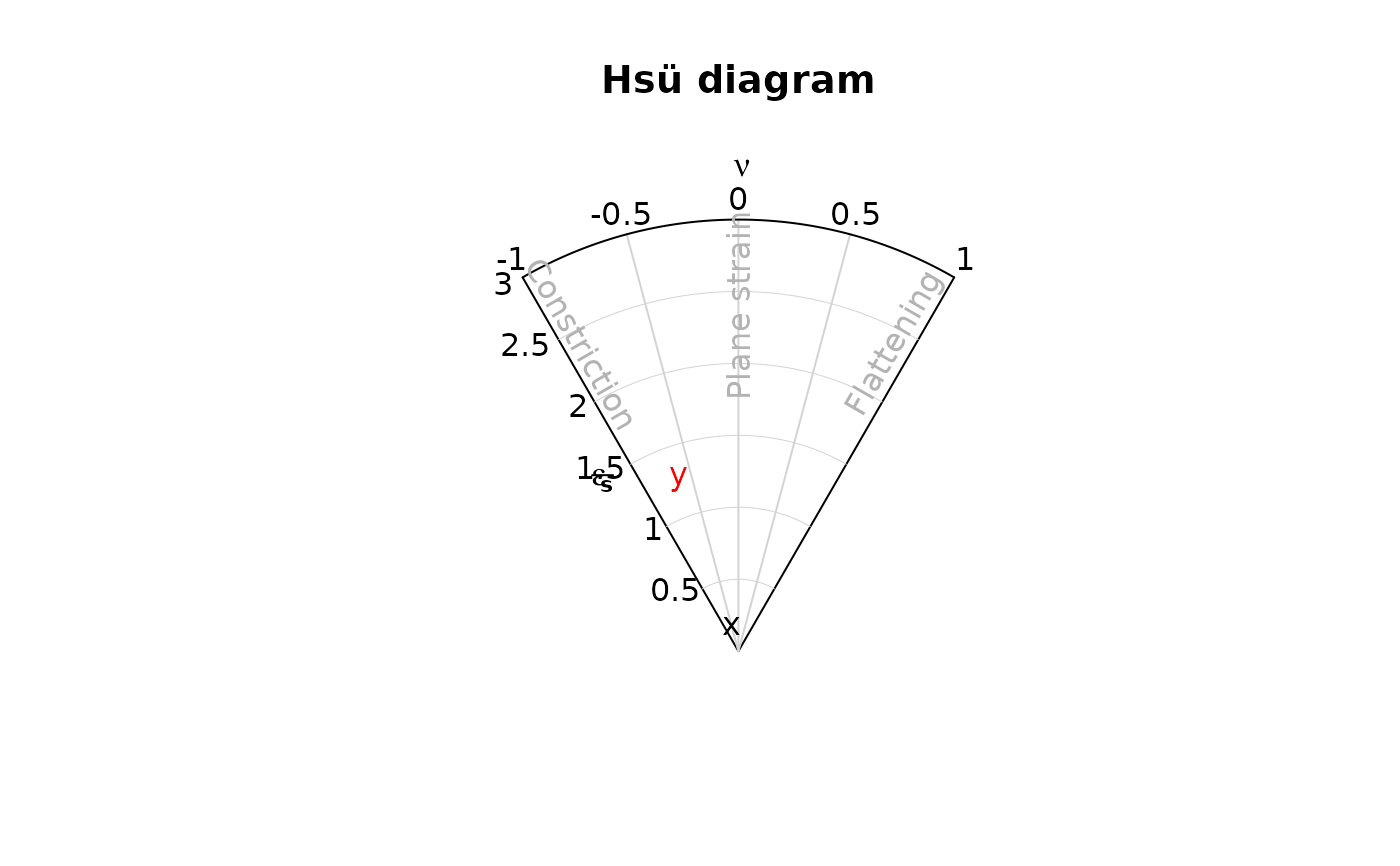
Fabric plot of Hsu (1965)
Arguments
- x
object of class
"Vec3","Line","Ray", or"Plane", where the rows are the observations and the columns are the coordinates.- labels
character. text labels
- add
logical. Should data be plotted to an existing plot?
- es.max
maximum strain for scaling.
- ...
optional parameters passed to
hsu_plot()
Value
plot and when stored as object, a list containing the Lode parameter lode and the natural octahedral strain es.
References
Hsu, T. C. (1966). The characteristics of coaxial and non-coaxial strain paths. Journal of Strain Analysis, 1(3), 216–222. https://doi.org/10.1243/03093247V013216
See also
ell_lode() for Lode parameter, and ell_nadai for natural octahedral strain.