tectonicr is a free and open-source R package for modeling and analyzing the direction of the maximum horizontal stress (SHmax) based on the empirical link between the direction of intraplate stress and the direction of the relative motion of neighboring plates (Wdowinski, 1998; Stephan et al., 2023). The following methods are available:
-
Direction of the plate boundary forces:
PoR_shmax()gives the predicted stress field adjacent to a plate boundary, calculated using the relative plate motion of the neighboring plates using the functionmodel_shmax(). The goodness-of-fit can be statistically tested by e.g.circular_dispersion(),rayleigh_test(), andconfidence_interval(). -
Distance to plate boundary:
distance_from_pb()gives the distance between the stress data point and the plate boundary measured along the stress trajectories. -
Trajectories of the theoretical stress field
eulerpole_paths()generates ansfobject containing spatial information that is suitable to plot with, for instance,ggplot(). -
Azimuth plotting using
geom_azimuth()orgeom_azimuthpoint()in ggplot. -
Relative rotations from a given set of plate motion parameters:
equivalent_rotation()transfers a set of plate motion parameters into the relative plate motions among the given plates. - Average direction and variance of a set of SHmax data using (weighted) statistics and other parameters to statistically estimate the distribution parameters of pi-directional data.
-
Spatial interpolation of of SHmax:
PoR_stress2grid()uses distance, method, and quality-weighted mean direction of stress data without being affected by angular distortions. -
Rose plot
rose()shows the frequencies of the orientations in polar coordinates -
Stress anomaly map: spatial distribution of the dispersion of the observed stress field from the directions of plate boundary forces with
kernel_dispersion() -
Download and filter world stress map data using
download_WSM()
The {tectonicr} package is all about orientation data in 2D. For analyzing orientations in 3D (spherical statistics, equal-area projections, etc. ), check out the structr package!
Prerequisites
You must have R installed on your system (see https://www.r-project.org/). To install tectonicr from CRAN, type the following code at the R command line prompt:
install.packages("tectonicr")Installation
The most recent development version of tectonicr is available from Github and can be installed on your system as follows:
# install.packages("remotes") # install if needed
remotes::install_github('tobiste/tectonicr')
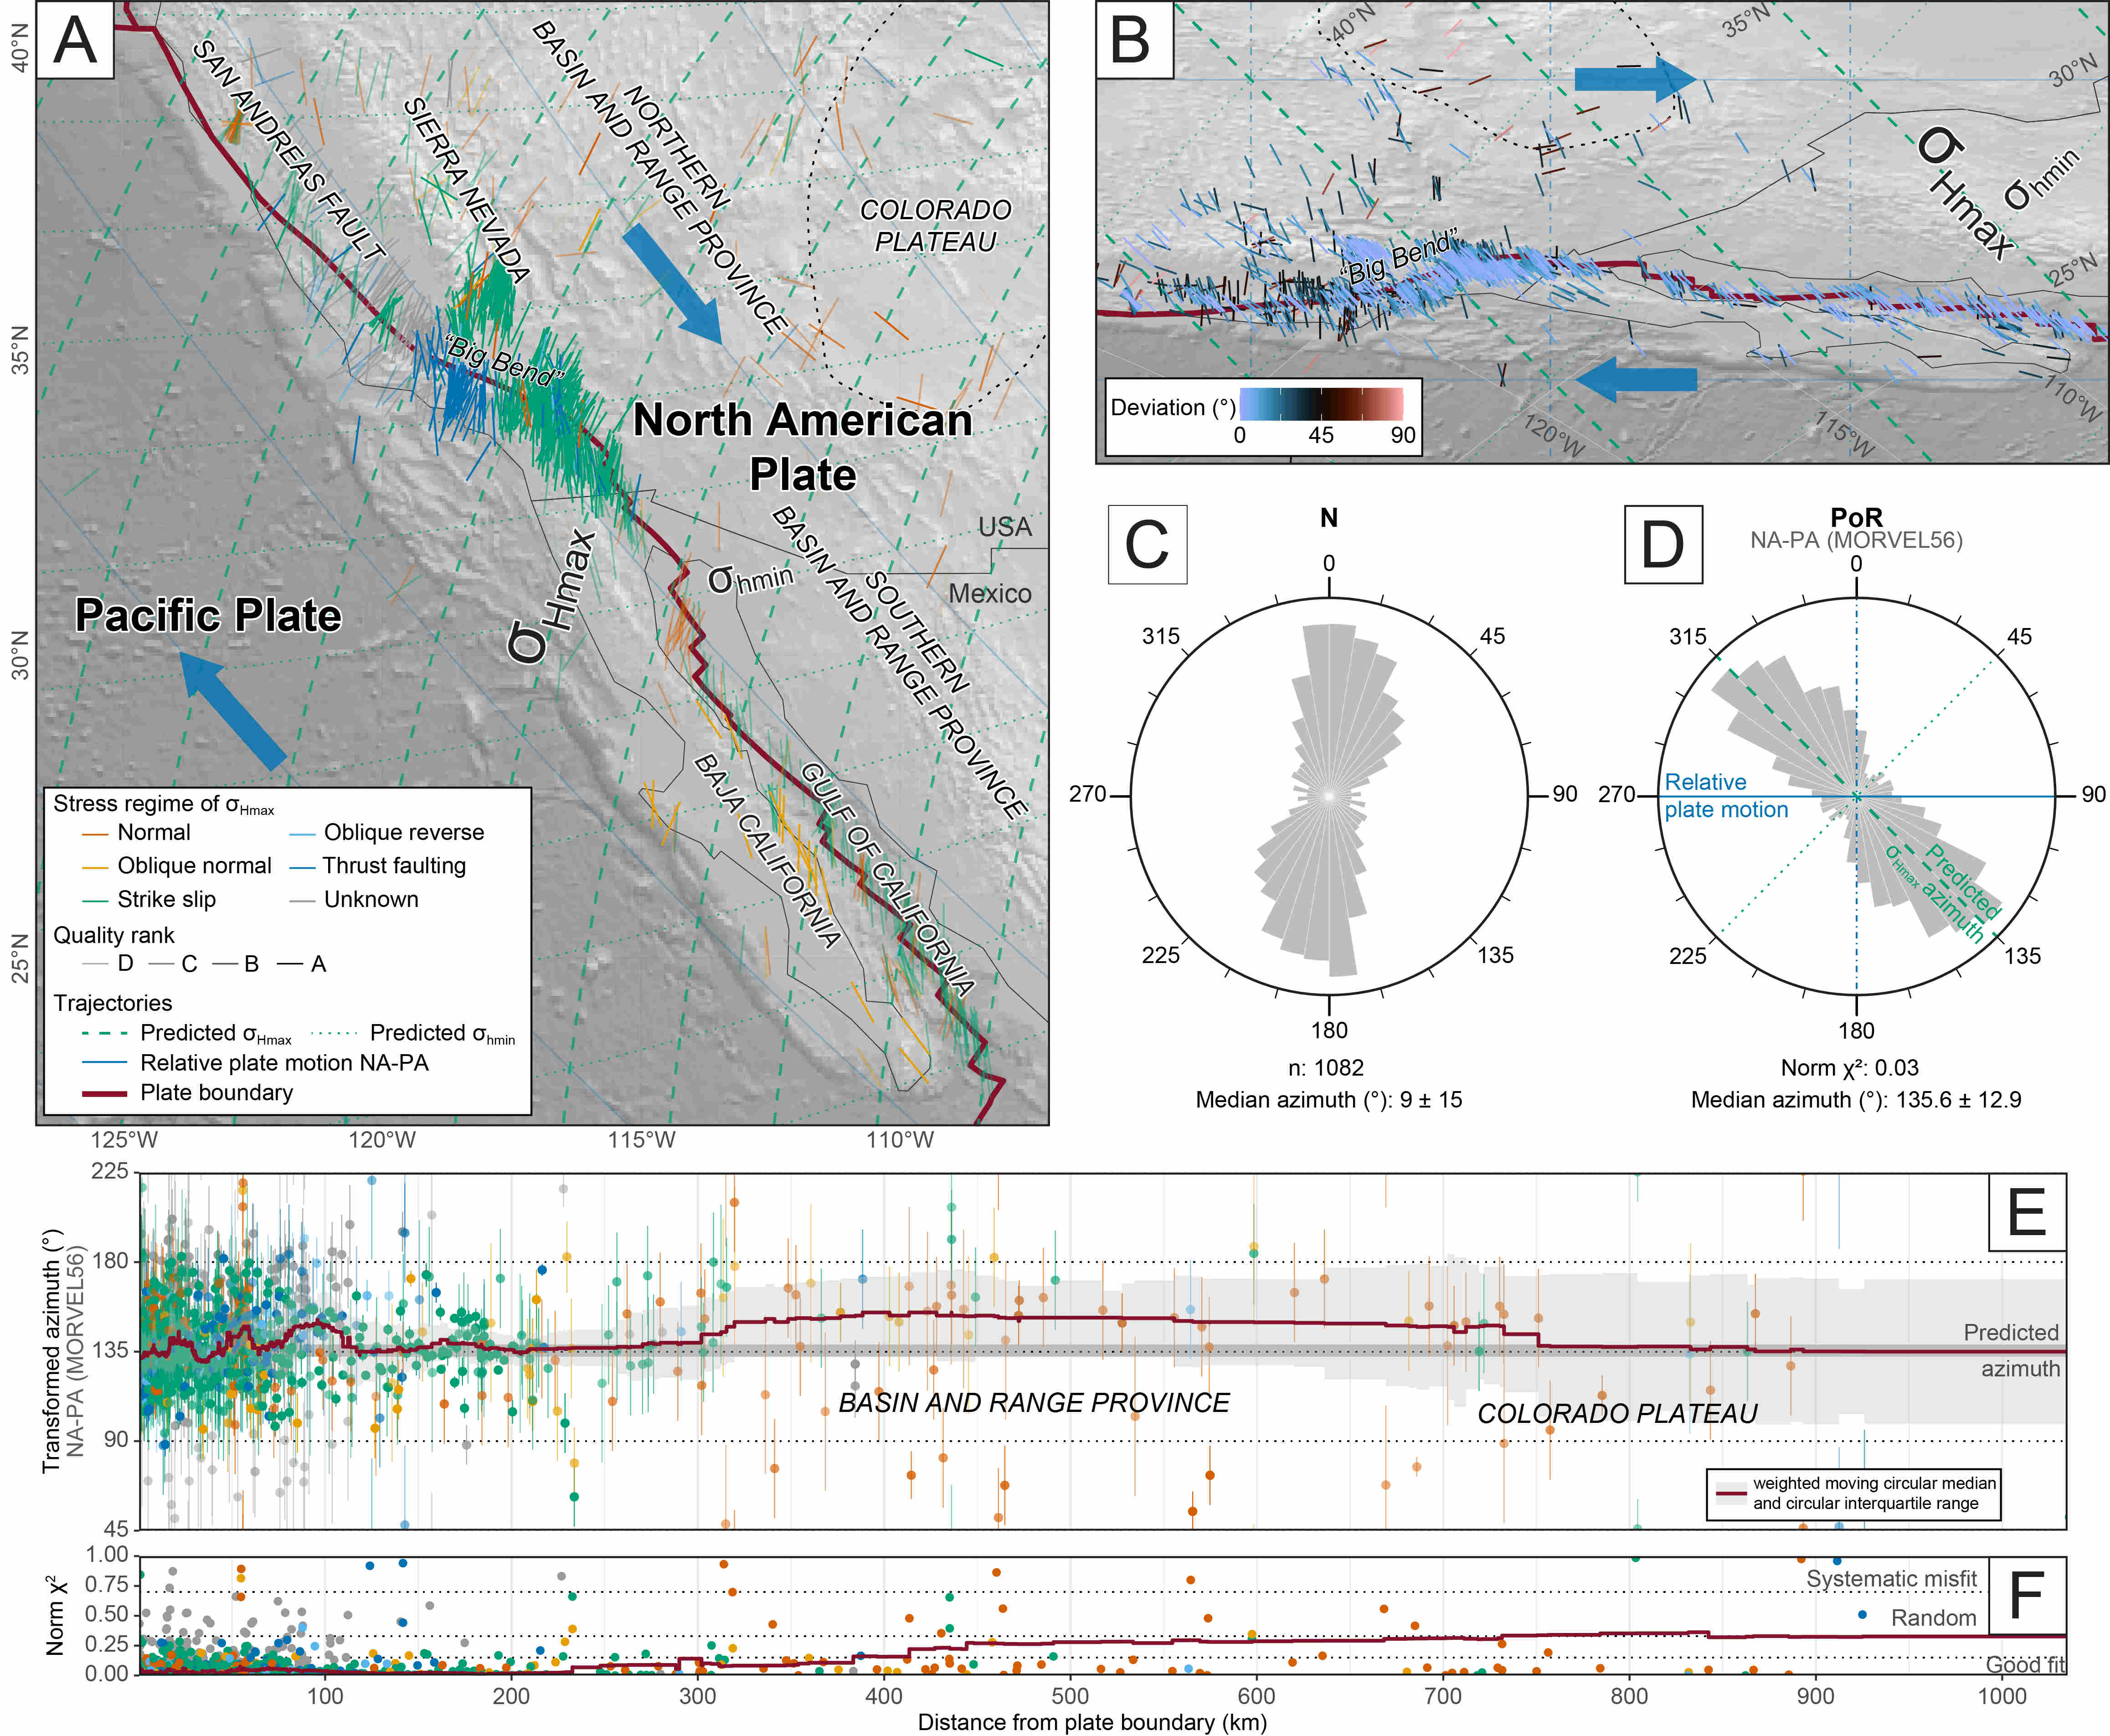
library('tectonicr')Using the stress measurements from the San Andreas Fault - Gulf of California example, a quick analysis and test against the right-lateral transform plate boundary can be achieved by:
# load example data
data(san_andreas)
data(nuvel1)
data(plates)

stress_analysis(
san_andreas,
PoR = equivalent_rotation(nuvel1, "na", "pa"),
type = "right",
pb = subset(plates, pair == "na-pa")
)
The code produces the underlying results for Fig. 7 from Stephan et al. (2023)
Documentation
The detailed documentation can be found at https://tobiste.github.io/tectonicr/articles/A_tectonicr.html
GUI
There is a graphical user interface that provides some (limited) tectonicr functionalities. No need to install, just click on the link and you can run tectonicr on your browser:
Author
Tobias Stephan (tstephan@lakeheadu.ca)
Feedback, issues, and contributions
I welcome feedback, suggestions, issues, and contributions! If you have found a bug, please file it here with minimal code to reproduce the issue.
How to cite tectonicr
When referencing this package, please cite
Stephan, T., Enkelmann, E., and Kroner, U. (2023). Analyzing the horizontal orientation of the crustal stress adjacent to plate boundaries. Scientific Reports, 13(1). DOI: 10.1038/s41598-023-42433-2.
and the package DOI: 10.32614/CRAN.package.tectonicr.