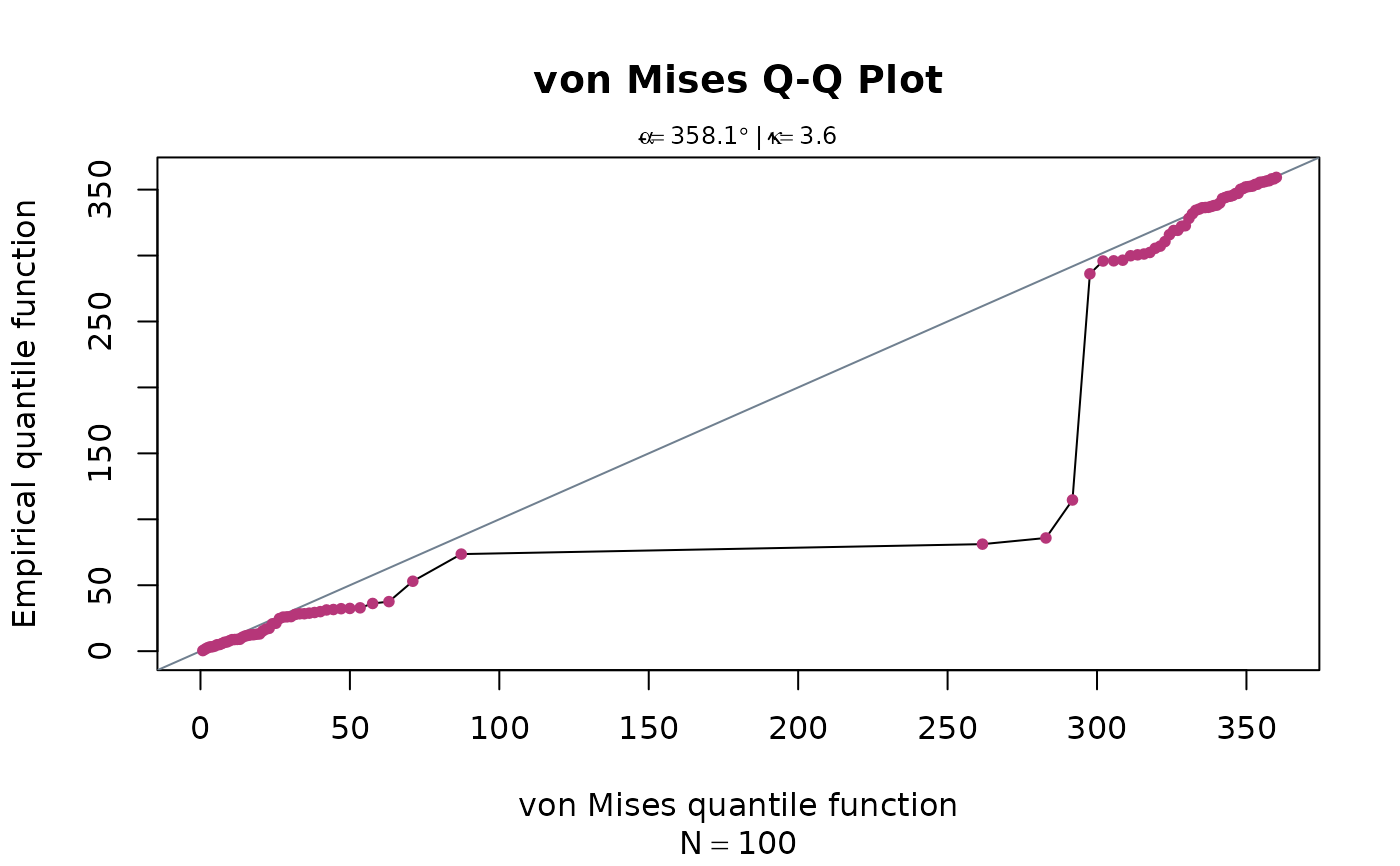
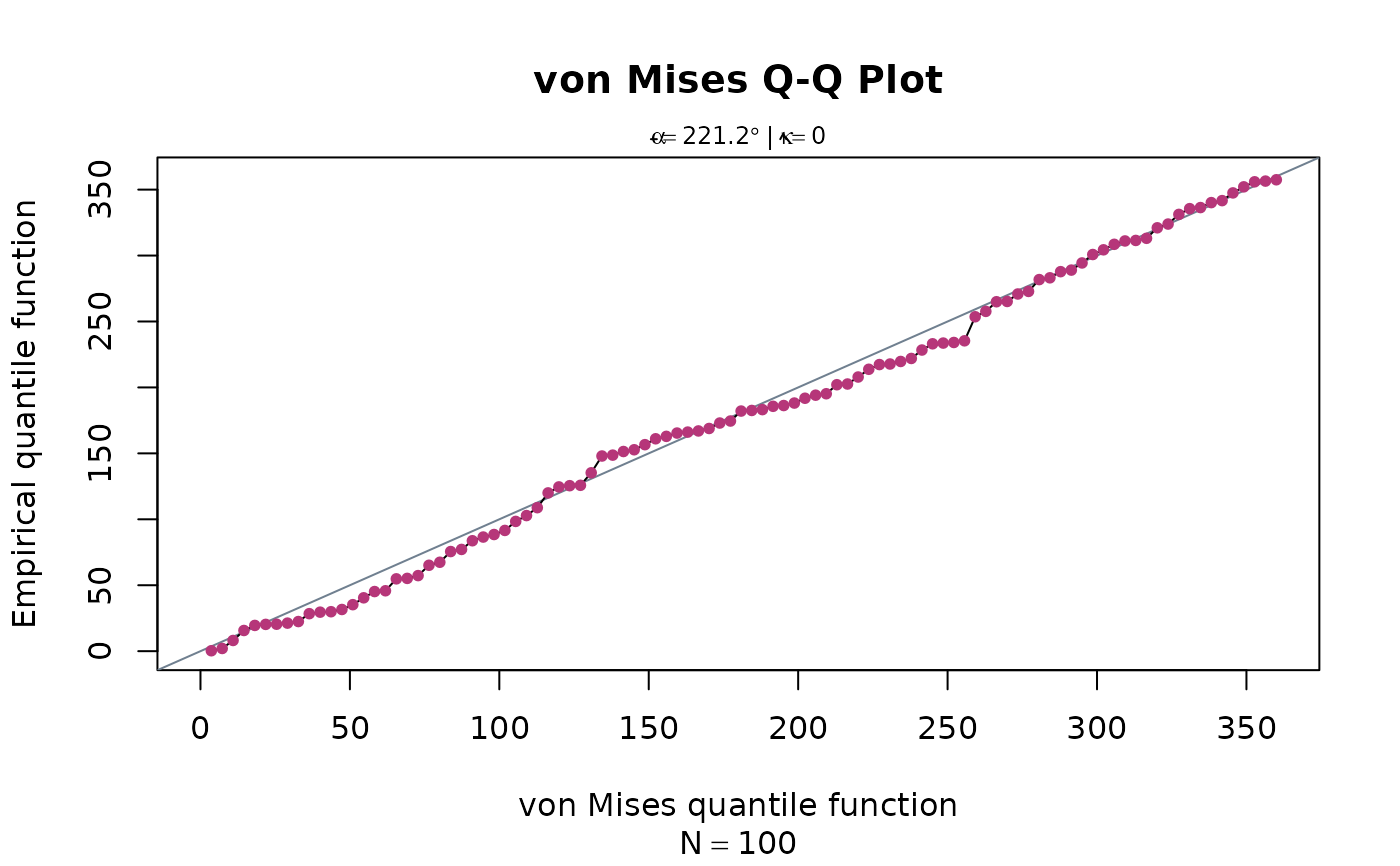
Produces a Q-Q plot of the data against a specified von Mises distribution to graphically assess the goodness of fit of the model.
Usage
vm_qqplot(
  x,
  w = NULL,
  axial = TRUE,
  mean = NULL,
  kappa = NULL,
  xlab = "von Mises quantile function",
  ylab = "Empirical quantile function",
  main = "von Mises Q-Q Plot",
  col = "#B63679FF",
  add_line = TRUE,
  ...
)
Arguments
- x
numeric. Angles in degrees
- w
numeric. optional weightings for
xto estimatemeanandkappa.- axial
Logical. Whether data are uniaxial (
axial=FALSE)- mean
numeric. Circular mean of the von Mises distribution. If
NULL, it will be estimated fromx.- kappa
numeric. Concentration parameter of the von Mises distribution. If
NULL, it will be estimated fromx.- xlab, ylab, main
plot labels.
- col
color for the dots.
- add_line
logical. Whether to connect the points by straight lines?
- ...
graphical parameters


