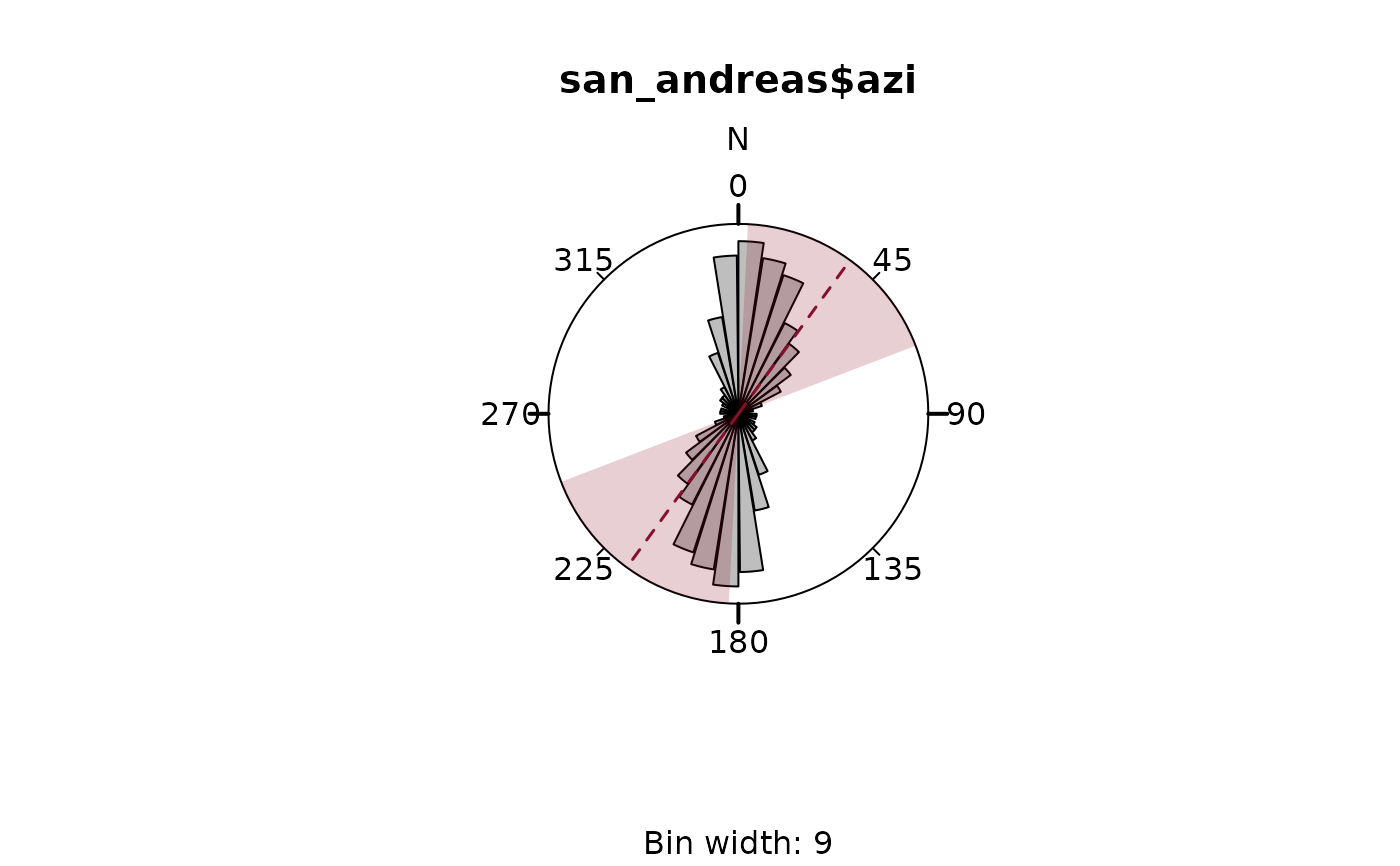
Adds the average direction (and its spread) to an existing rose diagram.
Usage
rose_stats(
  x,
  weights = NULL,
  axial = TRUE,
  avg = c("mean", "median", "sample_median"),
  spread = c("CI", "fisher", "sd", "IQR", "mdev"),
  avg.col = "#B63679FF",
  avg.lty = 2,
  avg.lwd = 1.5,
  spread.col = ggplot2::alpha("#B63679FF", 0.2),
  spread.border = FALSE,
  spread.lty = NULL,
  spread.lwd = NULL,
  add = TRUE,
  ...
)
Arguments
- x
Data to be plotted. A numeric vector containing angles (in degrees).
- weights
Optional vector of numeric weights associated with x.
- axial
Logical. Whether data are uniaxial (
axial=FALSE) or biaxial (TRUE, the default).- avg
character. The average estimate for x. Either the circular mean (
"mean", the default), the circular Quasi Median ("median"), or the sample median ("sample_median").- spread
character. The measure of spread to be plotted as a fan. Either Batchelet's 95% confidence interval by (
"CI", the default), Fisher's 95% confidence interval ("fisher"), the circular standard deviation ("sd"), the Quasi interquartile range on the circle ("IQR"), or the sample median deviation ("mdev").NULLif no fan should be drawn.- avg.col
color for the average line
- avg.lty
line type of the average line
- avg.lwd
line width of the average line
- spread.col
color of the spread fan
- spread.border
logical. Whether to draw a border of the fan or not.
- spread.lty
line type of the spread fan's border
- spread.lwd
line width of the spread fan's border
- add
logical.
- ...
optional arguments to
circular_plot()if add isFALSE.
See also
circular_mean(), circular_median(), circular_sample_median(),
confidence_interval(), confidence_interval_fisher(),
circular_sd(), circular_IQR(), circular_sample_median_deviation()
for statistical parameters.
Other rose-plot:
plot_density(),
plot_points(),
rose(),
rose_geom

