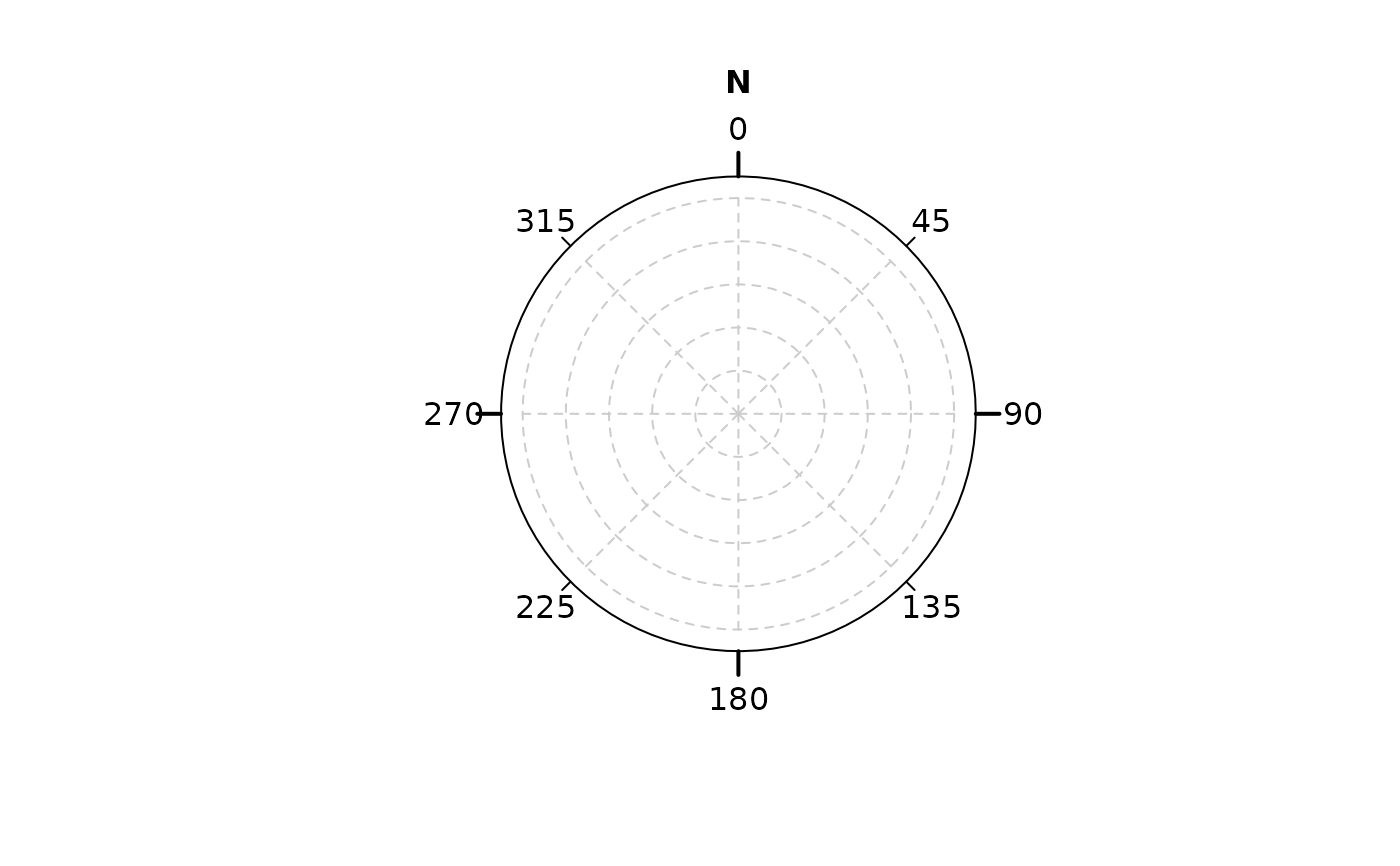
Polar diagram where angles increase clockwise.
Arguments
- main
a main title for the plot, see also
title.- sub
a subtitle for the plot.
- labels
Either a logical value indicating whether to plot labels next to the tick marks, or a vector of labels for the tick marks.
- at
Optional vector of angles at which tick marks should be plotted. Set
at=numeric(0)to suppress tick marks.- cborder
logical. Whether to plot the primitive of the circular plot (
TRUEby default) or not.- radius
numeric. The radius of the circular plot.
1by default.- scale
numeric. Increases the radius of the border to have some in-plot clearance.
1.1by default- grid
logical. Whether to add a grid to the circular plot. Default is
FALSE.- grid.lines, grid.circles
numeric. Adds a sequence of straight grid lines and circles based on angles (in degrees) and radii, respectively. Ignored when
grid=FALSE- origin.text
character. String to be drawn at the top margin of the plot (
"N"by default)- ...
optional parameters passed to
graphics::symbols()for plotting border of circular plot. Ignored ifcborder=FALSE.