Add points to a plot of circular data points on the current graphics device.
Usage
plot_points(
  x,
  axial = TRUE,
  stack = FALSE,
  binwidth = 1,
  cex = 1,
  sep = 0.025,
  jitter_factor = 0,
  ...,
  scale = 1.1,
  add = TRUE,
  main = NULL,
  labels = TRUE,
  at = seq(0, 360 - 45, 45),
  cborder = TRUE
)
Arguments
- x
Data to be plotted. A numeric vector containing angles (in degrees).
- axial
Logical. Whether data are uniaxial (
axial=FALSE) or biaxial (TRUE, the default).- stack
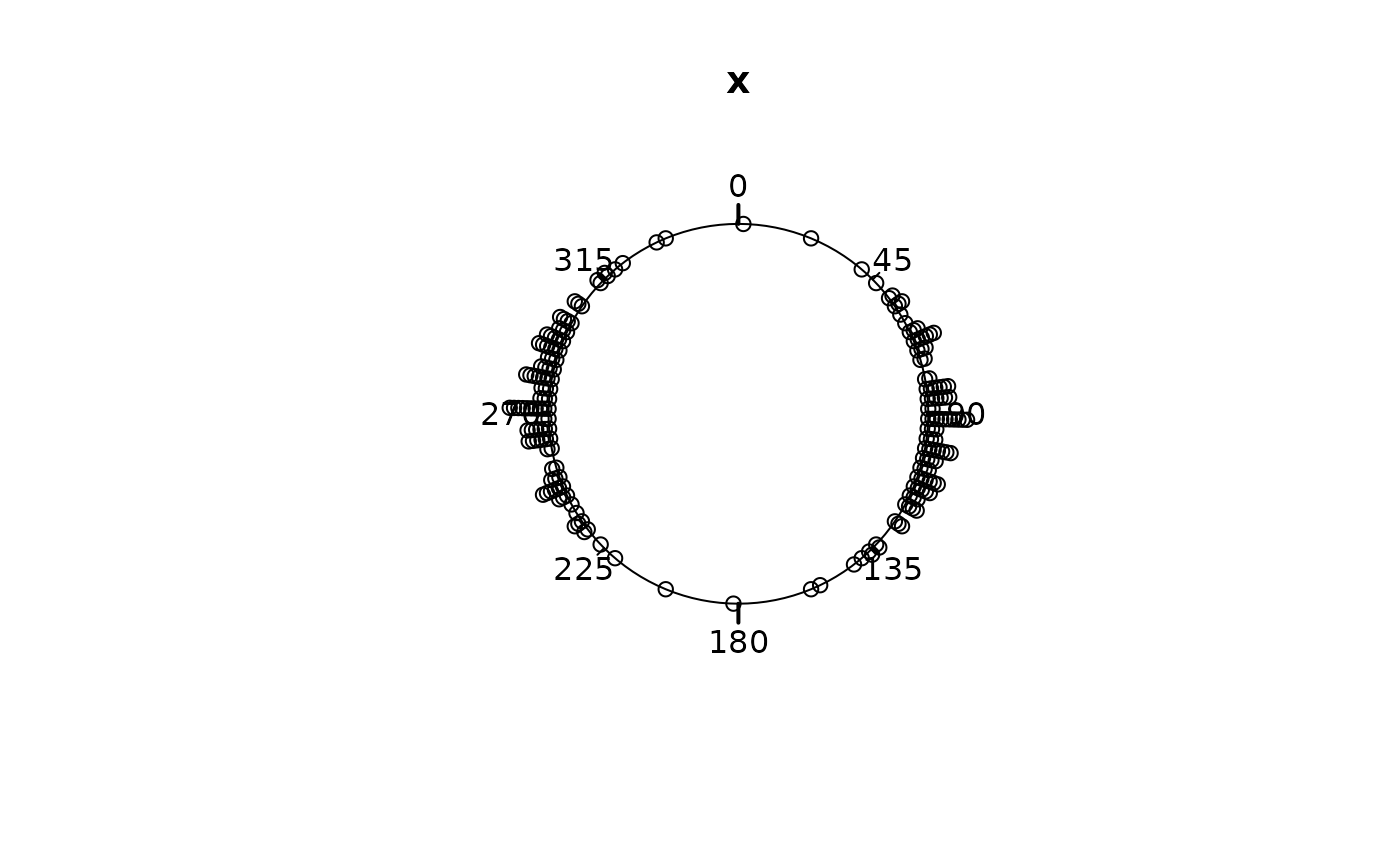
logical: if
TRUE, points are stacked on the perimeter of the circle. Otherwise, all points are plotted on the perimeter of the circle. Default isFALSE.- binwidth
numeric. Bin width (in degrees) for the stacked dot plots. ignored when
stack==FALSE. Is set to1degree by default.- cex
character (or symbol) expansion: a numerical vector. This works as a multiple of
par("cex").- sep
constant used to specify the distance between stacked points, if
stack==TRUEor in the case of more than one dataset. Default is0.025; smaller values will create smaller spaces.- jitter_factor
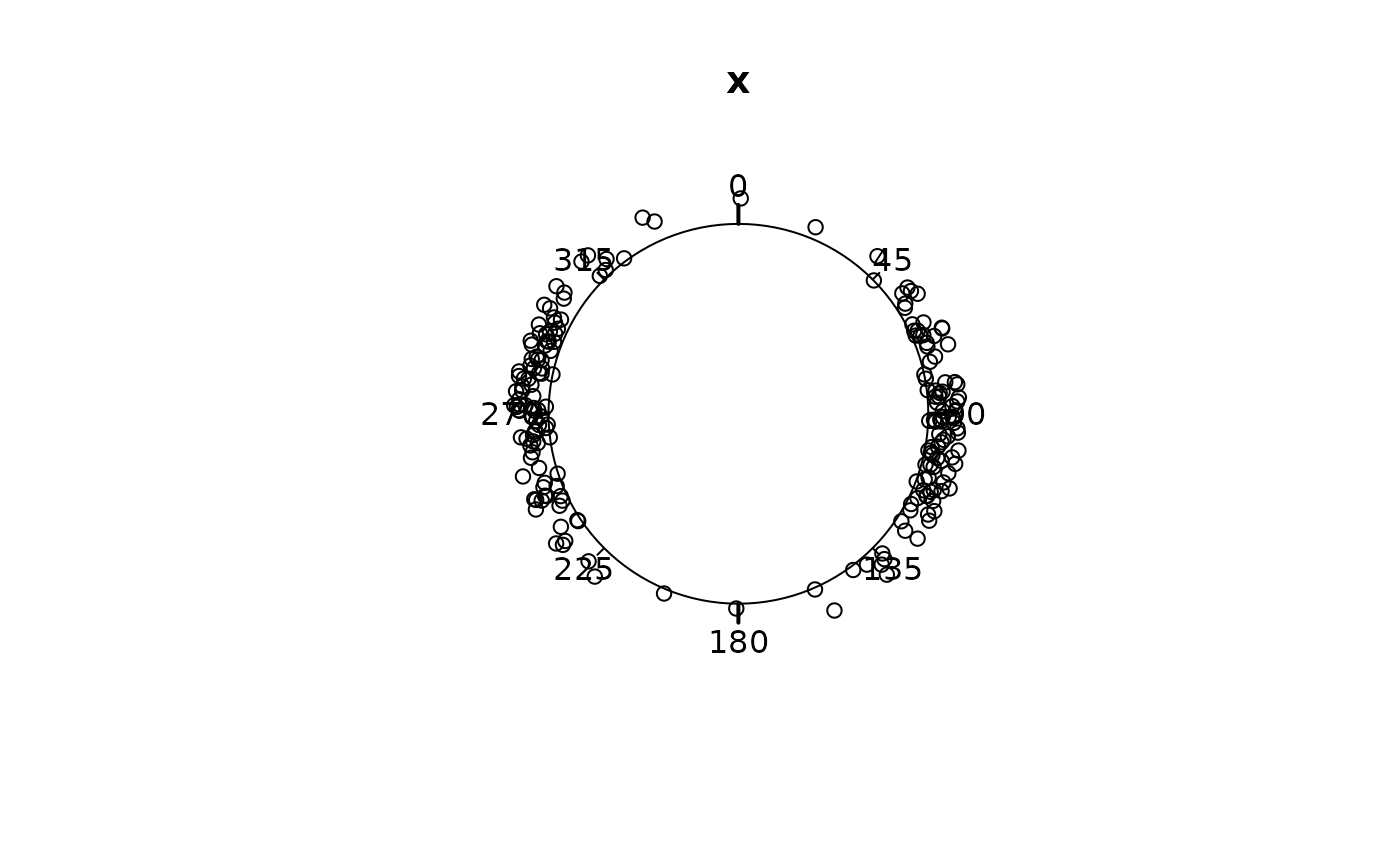
numeric. Adds a small amount of random variation to the location of each points along radius that is added to
scale. Jitter is ignored whenstack==TRUE). If0, no jitter is added (by default); if negative, the points fall into the circle.- ...
Further graphical parameters may also be supplied as arguments.
- scale
radius of plotted circle. Default is
1.1. Larger values shrink the circle, while smaller values enlarge the circle.- add
logical
- main
Character string specifying the title of the plot.
- labels
Either a logical value indicating whether to plot labels next to the tick marks, or a vector of labels for the tick marks.
- at
Optional vector of angles at which tick marks should be plotted. Set
at=numeric(0)to suppress tick marks.- cborder
logical. Border of rose plot.
See also
Other rose-plot:
plot_density(),
rose(),
rose_geom,
rose_stats()
Examples
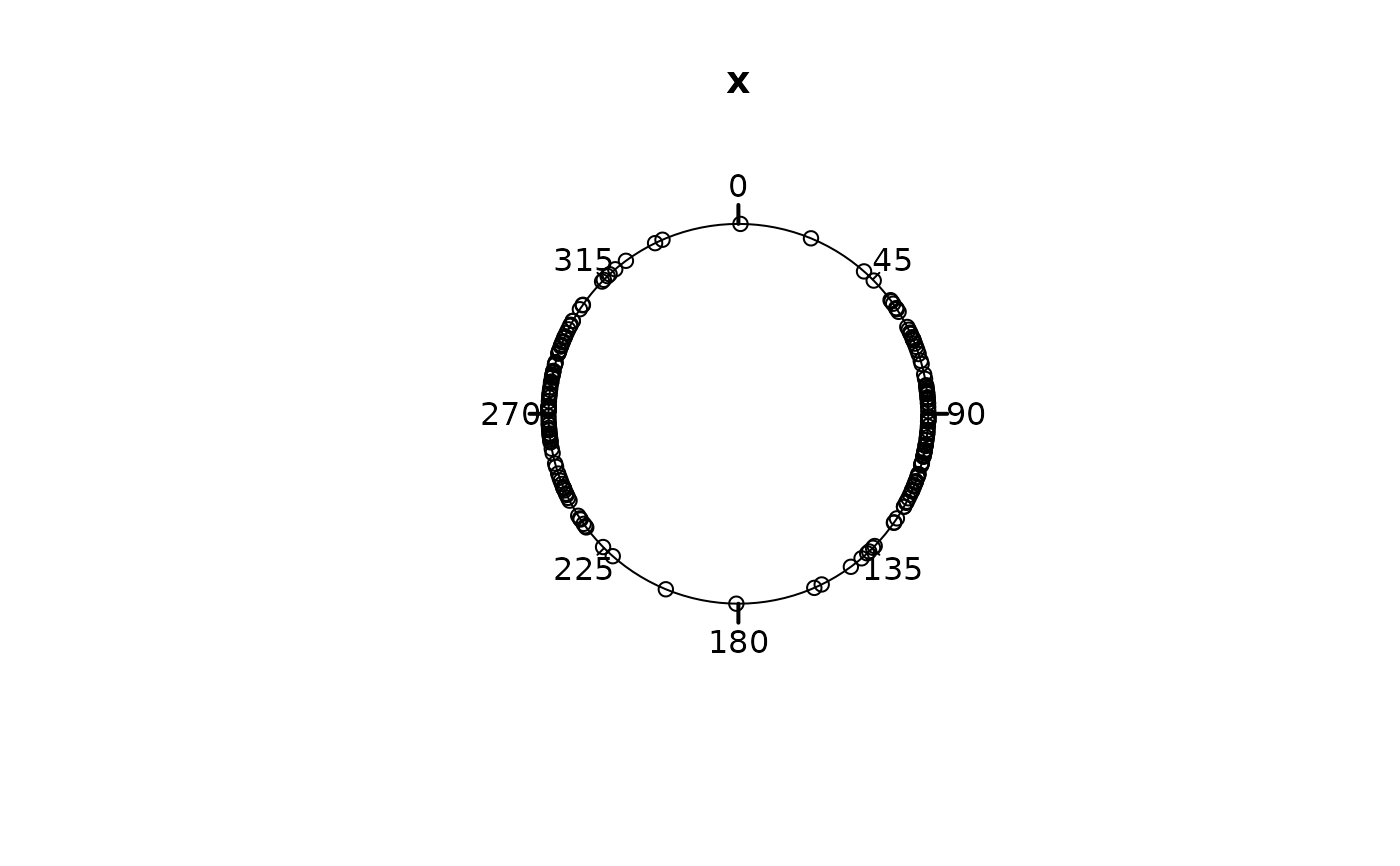
x <- rvm(100, mean = 90, k = 5)

# plot poinit without jitter
plot_points(x, add = FALSE)


# with some jitter
plot_points(x, jitter_factor = .2, add = FALSE)


# stacked dots:
plot_points(x, stack = TRUE, binwidth = 3, add = FALSE, xpd = TRUE)

