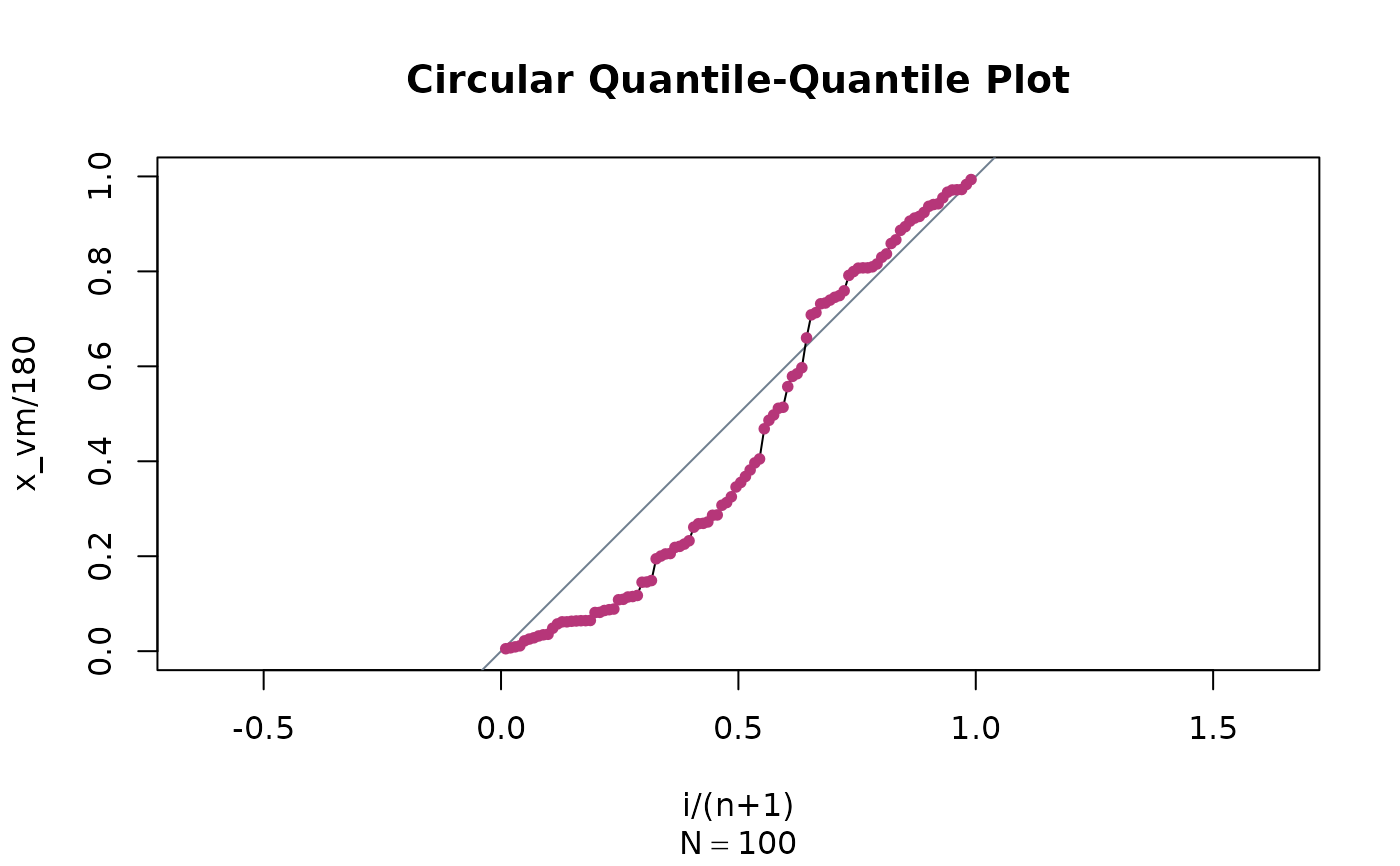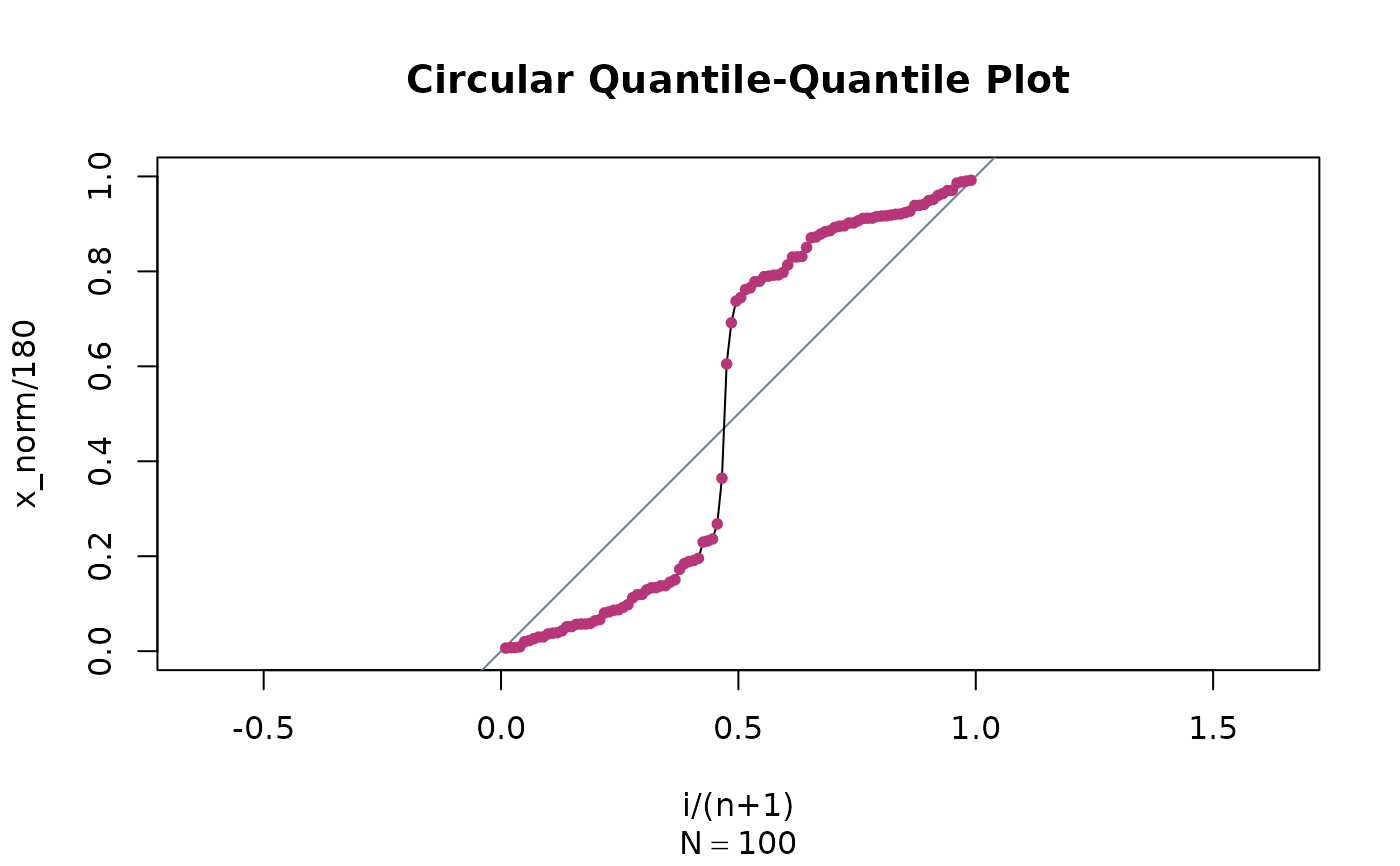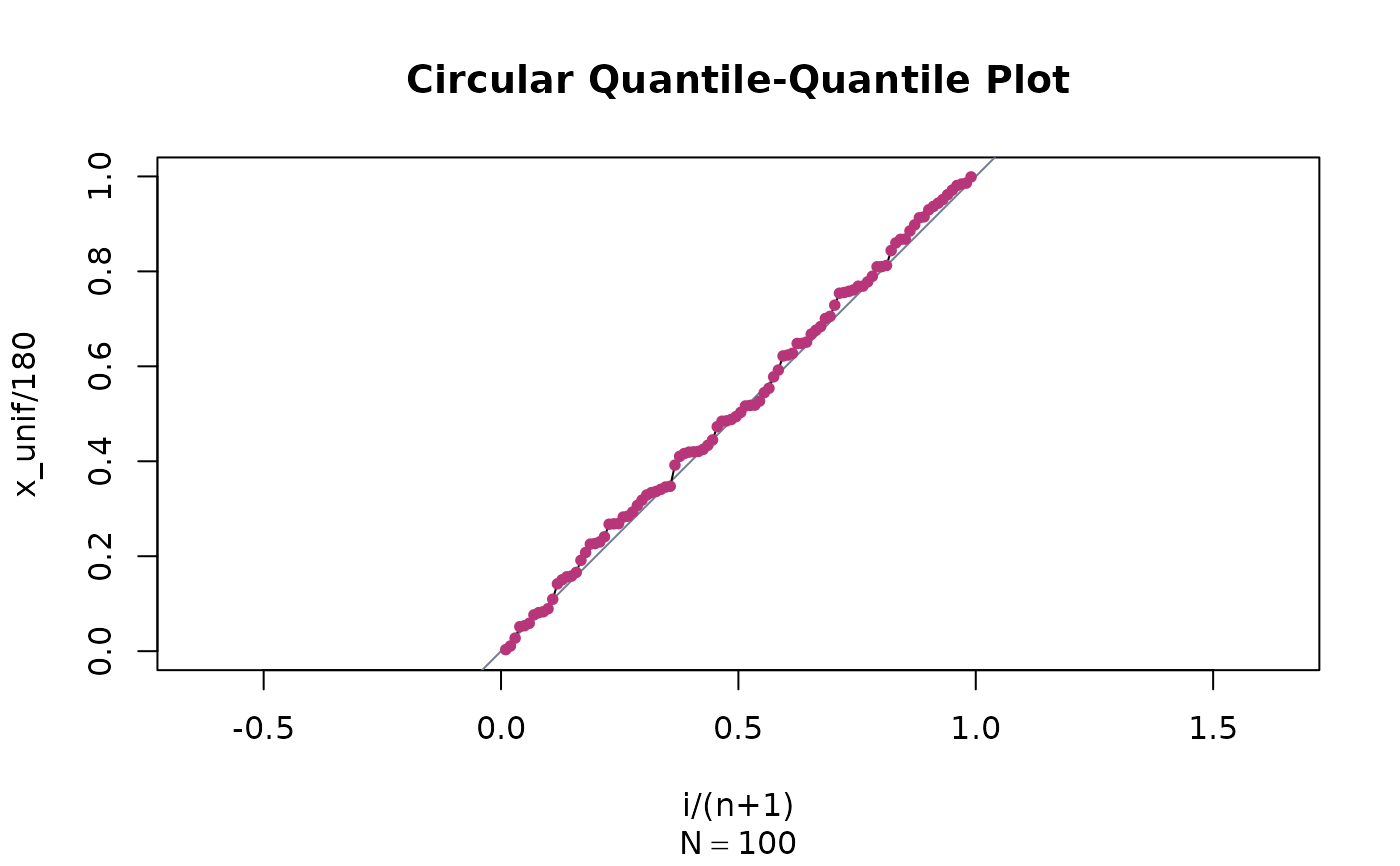
Quantile-Quantile Linearised Plot for Circular Distributions
Source:R/plotting.R
circular_qqplot.RdUniformly distributed orientations should yield a straight line through the origin. Systematic departures from linearity will indicate preferred orientation.
Usage
circular_qqplot(
  x,
  axial = TRUE,
  xlab = paste("i/(n+1)"),
  ylab = NULL,
  main = "Circular Quantile-Quantile Plot",
  add_line = TRUE,
  col = "#B63679FF",
  ...
)References
Borradaile, G. J. (2003). Statistics of earth science data: their distribution in time, space, and orientation (Vol. 351, p. 329). Berlin: Springer.
See also
Other circ-qqplot:
vm_qqplot()