Elliptical Concentration and Confidence Cone Estimation
Source:R/vector_stats.R
bingham_statistics.RdElliptical Concentration and Confidence Cone Estimation
Source
Borradaile, G. (2003). Spherical-Orientation Data. In: Statistics of Earth Science Data. Springer, Berlin, Heidelberg. https://doi.org/10.1007/978-3-662-05223-5_10
Value
list
ktwo-column vector containing the estimates for the minimum (\(k_\text{min}\)) and maximum concentration (\(k_\text{max}\)).
a95two-column vector containing the estimates for the minimum and maximum 95% confidence cone.
betaThe shape factor of the distribution given by the ratio \(\frac{k_\text{min}}{k_\text{max}}\).
Examples
set.seed(1234)
x <- rfb(100, mu = Line(120, 50), k = 15, A = diag(c(-5, 0, 5)))
stereoplot()
stereo_point(x)
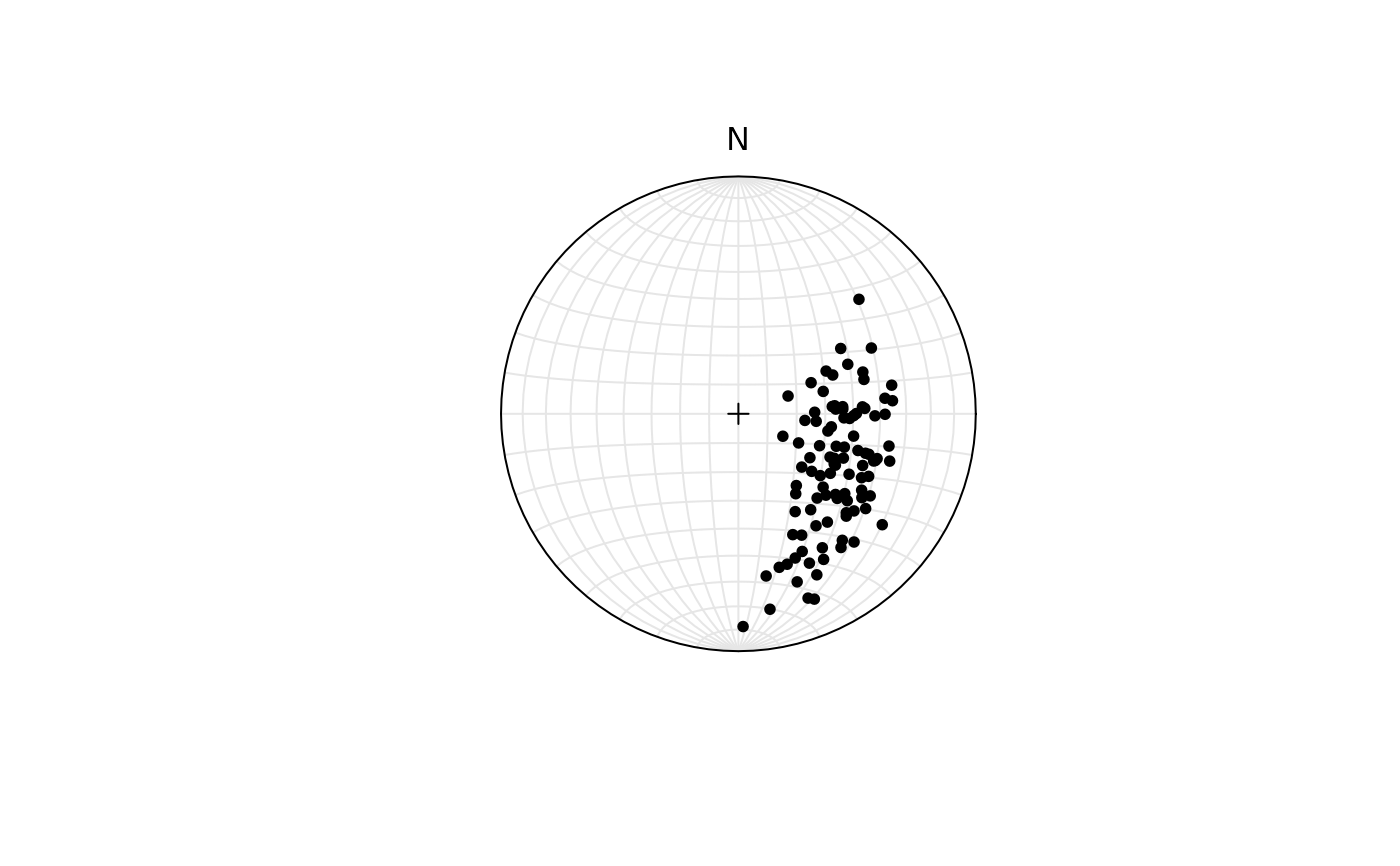 bingham_statistics(x)
#> $k
#> [1] 2.466239 3.487357
#>
#> $a95
#> [1] 8.914776 7.496868
#>
#> $beta
#> [1] 0.7071944
#>
bingham_statistics(x)
#> $k
#> [1] 2.466239 3.487357
#>
#> $a95
#> [1] 8.914776 7.496868
#>
#> $beta
#> [1] 0.7071944
#>