geom_azimuthpoint() draws line segments (spokes) like geom_azimuth(), but also
places a point (marker) at the spoke's center (x, y).
Aesthetic rules:
linewidth,linetypeaffect the spoke onlyshapeaffects the point onlycolour,alphaaffect both spoke and pointsizesets the size of the point only
Usage
geom_azimuthpoint(
  mapping = NULL,
  data = NULL,
  stat = "identity",
  center = TRUE,
  na.rm = FALSE,
  show.legend = NA,
  inherit.aes = TRUE,
  size = 2,
  ...
)
Arguments
- mapping
Set of aesthetic mappings created by
ggplot2::aes().- data
A data frame. If
NULL, the default, the data is inherited from the plot data as specified in the call toggplot2::ggplot().- stat
The statistical transformation to use on the data. Defaults to
"identity".- center
Logical; if
TRUEspokes are centered on (x, y) usingPositionCenterSpoke. IfFALSE, behaves likeggplot2::geom_spoke()(line starts at (x, y)).- na.rm
If
FALSE, the default, missing values are removed with a warning. IfTRUE, missing values are silently removed.- show.legend
Logical. Should this layer be included in the legends?
- inherit.aes
If
FALSE, overrides the default aesthetics, rather than combining with them.- size
Size of the point marker (default = 2).
- ...
Other arguments passed on to
geom_azimuth()andggplot2::geom_point(). These may includearrow,fill, etc.
Aesthetics
geom_azimuthpoint() understands the following aesthetics (required aesthetics in bold):
x
y
angle (in degrees, transformed internally; spoke only)
radius (spoke only)
colour (shared)
alpha (shared)
linewidth (spoke only)
linetype (spoke only)
shape (point only)
size (point only, or via argument)
fill (point only, for shapes that accept fill)
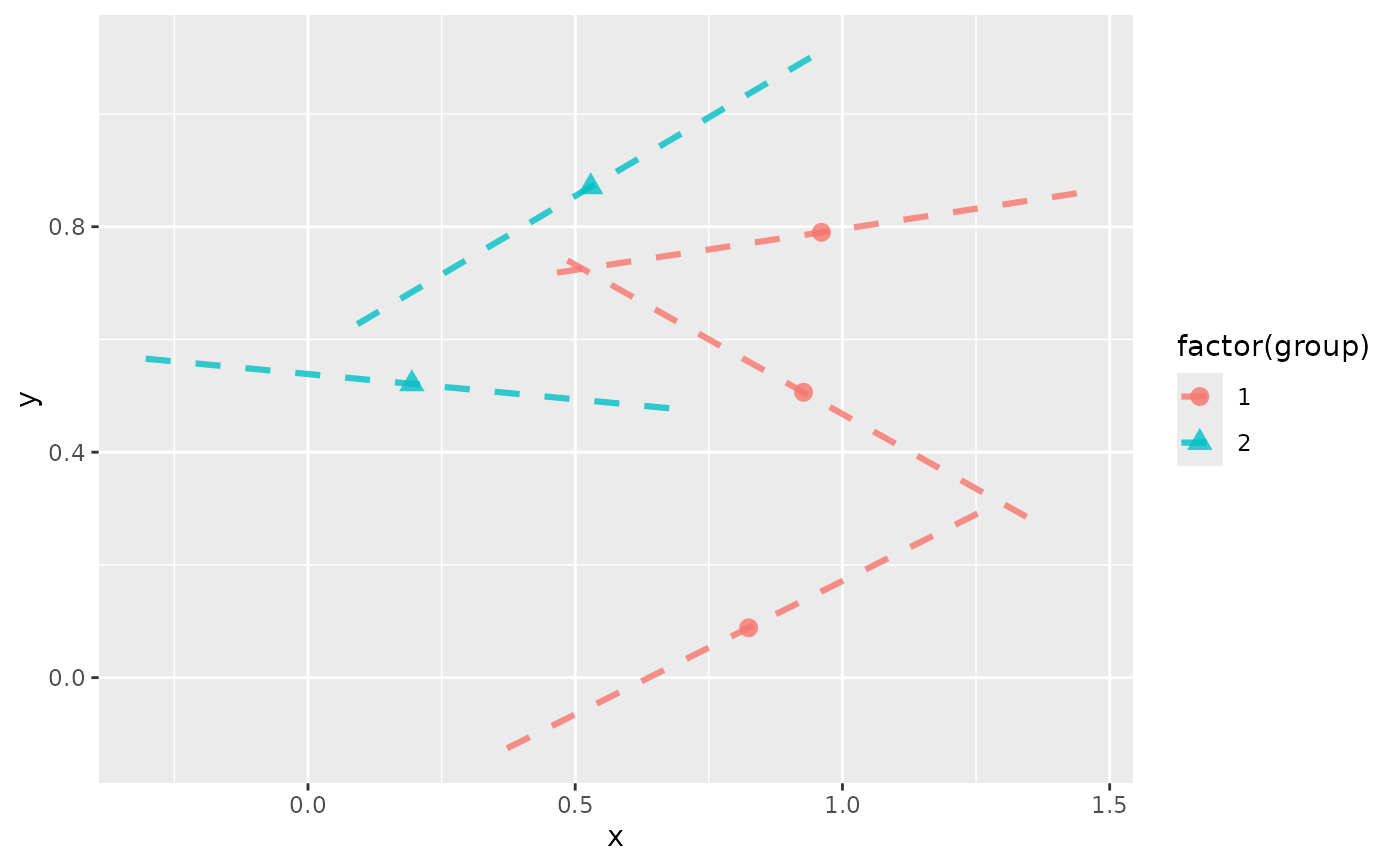
Examples
set.seed(20250411)
df <- data.frame(
  x = runif(5), y = runif(5),
  angle_deg = rvm(5, mean = 90, kappa = 10),
  radius = runif(5, 0.1, 1),
  group = rep(1:2, length.out = 5)
)

if (require("ggplot2")) {
  ggplot(data = df, aes(x, y, angle = angle_deg, radius = radius)) +
    geom_azimuthpoint(aes(colour = factor(group), shape = factor(group)),
      linewidth = 1.1, linetype = "dashed",
      size = 3, alpha = 0.8
    )
}