geom_azimuth() visualizes axial-directional vector fields using a geom to
produce a new graphical layer, which allows aesthetic options.
This layer can be overlaid on a map to improve visualisation of mapped data.
The geom draws line segments (spokes) centered at (x, y) with a given
orientation (angle in degrees) and length (radius). By default the spoke
is centered using PositionCenterSpoke, so that the given coordinates mark
the middle of the line. The azimuths are given as angles in degrees increasing clockwise from North.
Usage
geom_azimuth(
  mapping = NULL,
  data = NULL,
  stat = "azimuth",
  center = TRUE,
  radius = NULL,
  na.rm = FALSE,
  show.legend = NA,
  inherit.aes = TRUE,
  ...
)
Arguments
- mapping
Set of aesthetic mappings created by
ggplot2::aes().- data
A data frame. If
NULL, the default, the data is inherited from the plot data as specified in the call toggplot2::ggplot().- stat
The statistical transformation to use on the data. Defaults to
"identity".- center
Logical; if
TRUE(the default) spokes are centered on (x, y) usingPositionCenterSpoke- useful for axial data. IfFALSE, behaves likeggplot2::geom_spoke()(line starts at (x, y)) - useful for directional data (especially when in combination witharrow()).- radius
Length of spoke
- na.rm
If
FALSE, the default, missing values are removed with a warning. IfTRUE, missing values are silently removed.- show.legend
Logical. Should this layer be included in the legends?
- inherit.aes
If
FALSE, overrides the default aesthetics, rather than combining with them.- ...
Other arguments passed on to
ggplot2::layer(). These are often aesthetics (e.g.colour,linetype,linewidth,alpha).
Aesthetics
geom_azimuth() understands the following aesthetics (required aesthetics in bold):
x
y
angle (in degrees, transformed internally)
radius
colour
alpha
linewidth
linetype
Examples
set.seed(20250411)
df <- data.frame(
x = runif(5), y = runif(5),
angle_deg = rvm(5, mean = 90, kappa = 10),
radius = runif(5, 0.1, 2)
)
if (require("ggplot2")) {
ggplot(df, aes(x, y)) +
geom_azimuth(aes(angle = angle_deg), radius = .1, linewidth = 1.2, colour = "blue")
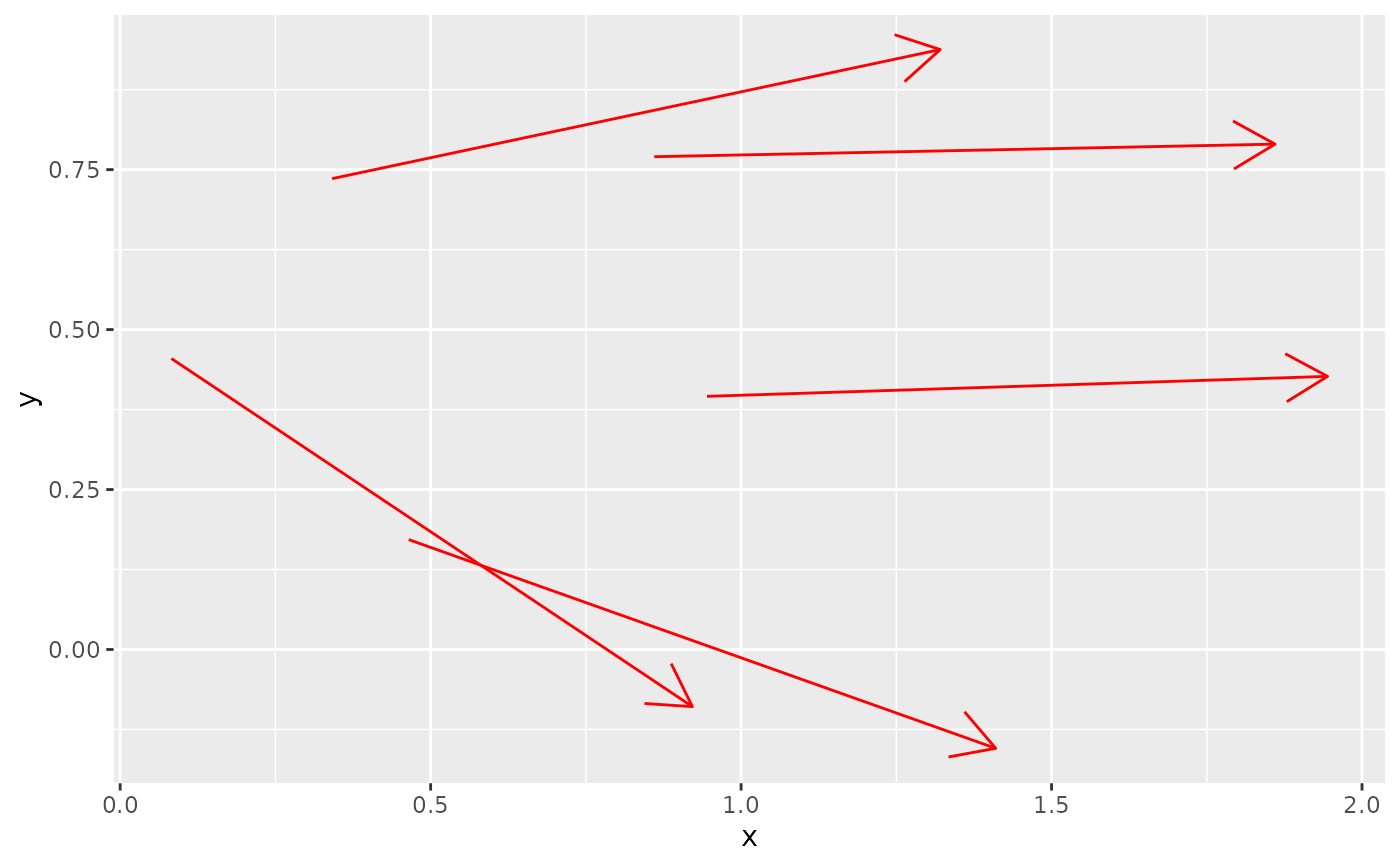
if (require("grid")) {
ggplot(df, aes(x, y, radius = radius)) +
geom_azimuth(aes(angle = angle_deg), center = FALSE, colour = "red", arrow = grid::arrow())
}
}
#> Loading required package: ggplot2
#> Loading required package: grid