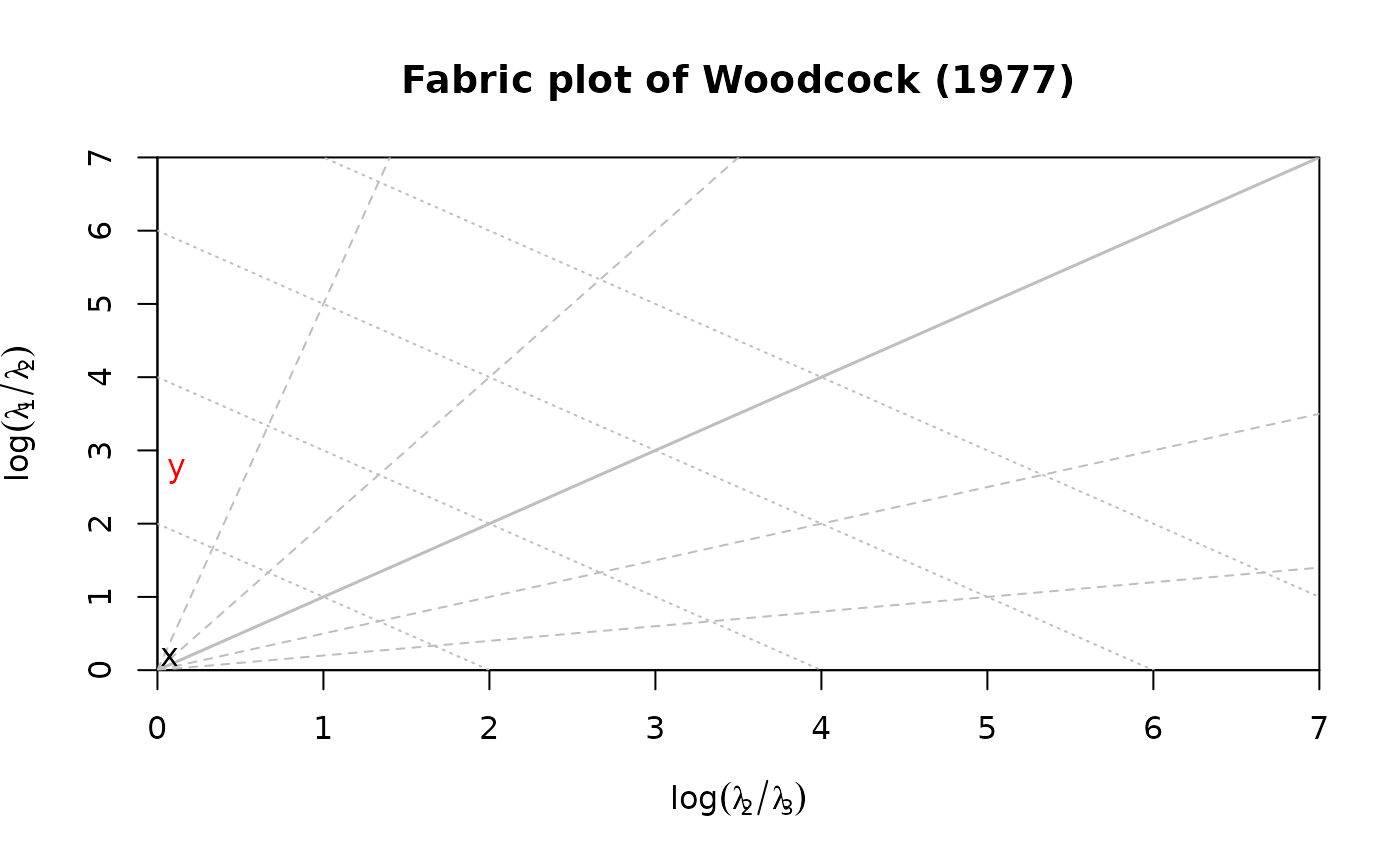
Creates a fabric plot using the eigenvalue method
Usage
WoodcockPlot(x, labels = NULL, add = FALSE, ...)
Arguments
- x
object of class "Vec3", "Line", or "Plane".
- labels
character. text labels
- add
logical. Should data be plotted to an existing plot?
- ...
optional graphical parameters
References
Woodcock, N. H. (1977). Specification of fabric shapes using an eigenvalue method. Geological Society of America Bulletin88, 1231<U+2013>1236. http://pubs.geoscienceworld.org/gsa/gsabulletin/article-pdf/88/9/1231/3418366/i0016-7606-88-9-1231.pdf
Examples
set.seed(1)
mu <- Line(120, 50)
x <- rvmf(100, mu = mu, k = 1)
WoodcockPlot(x, lab = "x", main = "Fabric plot of Woodcock (1977)")
y <- rvmf(100, mu = mu, k = 20)
WoodcockPlot(y, lab = "y", add = TRUE, col = "red")

