Spectral decomposition of the 2D orientation tensor into two Eigenvectors and corresponding Eigenvalues provides provides a measure of location and a corresponding measure of dispersion, respectively.
Usage
ot_eigen2d(x, w = NULL, scale = FALSE)

principal_direction(x, w = NULL)

axial_strength(x, w = NULL)

axial_dispersion(x, w = NULL)Value
ot_eigen2d returns a list of the Eigenvalues and the axial angles corresponding to the Eigenvectors.
principal_direction(), axial_strength() and axial_dispersion() are convenience functions
to return the orientation of the largest eigenvalue, the orientation strength, the axial dispersion respectively.
Details
The Eigenvalues (\(\lambda_1 > \lambda_2\)) can be interpreted as the fractions of the variance explained by the orientation of the associated Eigenvectors. The two perpendicular Eigenvectors (\(a_1, a_2\)) are the "principal directions" with respect to the highest and the lowest concentration of orientation data.
The strength of the orientation is the largest eigenvalue \(\lambda_1\) normalized
by the sum of the eigenvalues (scale=TRUE). Then \(\lambda_2 = 1-\lambda_1\) is a
measure of dispersion of 2D orientation data with respect to \(a_1\).
Note
Eigenvalues and Eigenvectors of the orientation tensor (inertia tensor) are also called "principle moments of inertia" and "principle axes of inertia", respectively.
Examples
test <- rvm(100, mean = 0, k = 10) / 2
ot_eigen2d(test)
#> eigen() decomposition
#> $values
#> [1] 0.97564247 0.02435753
#>
#> $vectors
#> [1] 1.66229 -88.33771
#>
data("nuvel1")
PoR <- subset(nuvel1, nuvel1$plate.rot == "na")
sa.por <- PoR_shmax(san_andreas, PoR, "right")
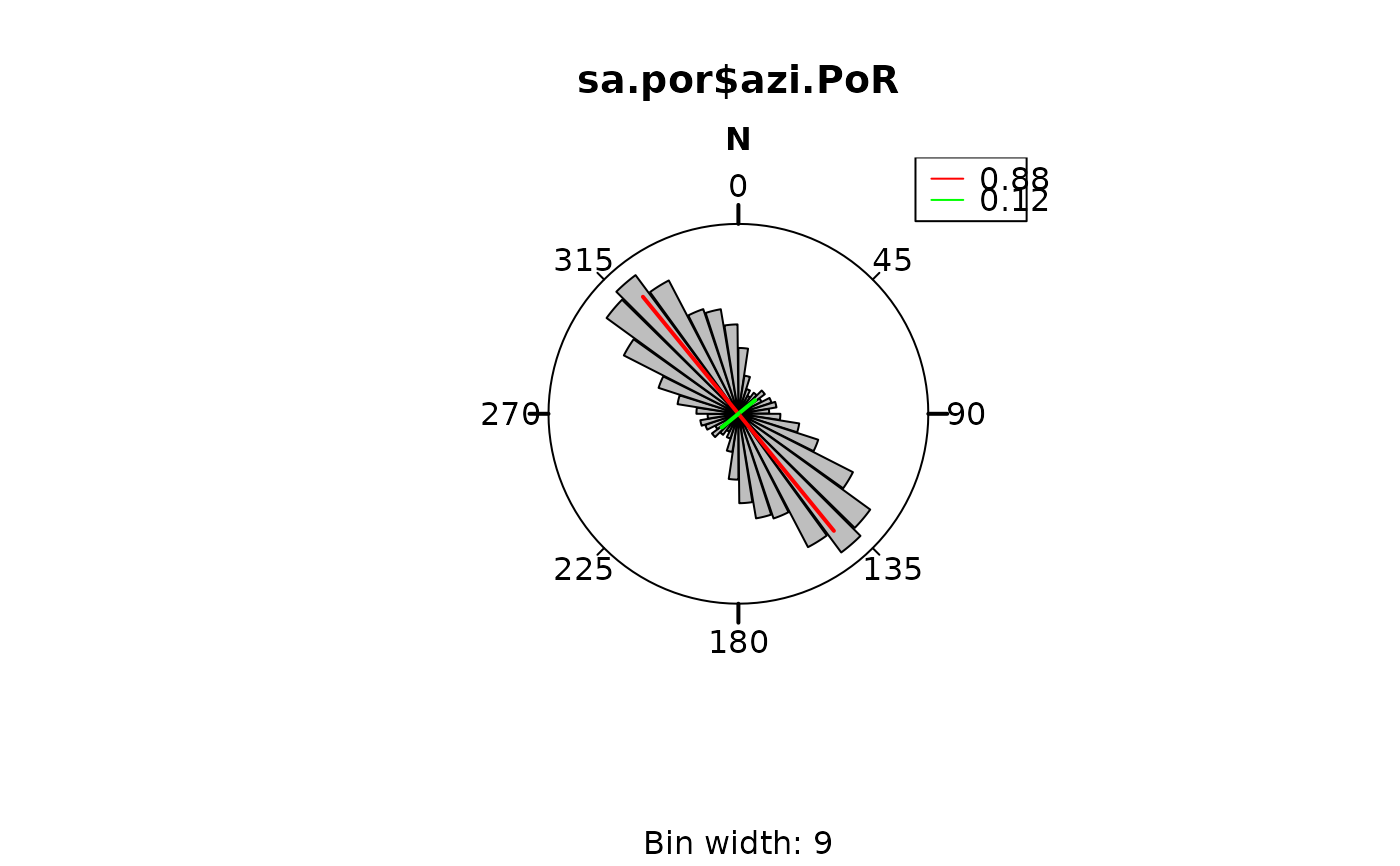
sa_eig <- ot_eigen2d(sa.por$azi.PoR, w = weighting(san_andreas$unc), scale = TRUE)
print(sa_eig)
#> eigen() decomposition
#> $values
#> [1] 0.8750106 0.1249894
#>
#> $vectors
#> [1] -39.20782 50.79218
#>
rose(sa.por$azi.PoR, muci = FALSE)
rose_line(sa_eig$vectors,
col = c("red", "green"),
radius = sa_eig$values, lwd = 2
)
graphics::legend("topright",
legend = round(sa_eig$values, 2),
col = c("red", "green"), lty = 1
)
 principal_direction(sa.por$azi.PoR)
#> [1] -39.12223
axial_strength(sa.por$azi.PoR)
#> [1] 0.8579857
axial_dispersion(sa.por$azi.PoR)
#> [1] 0.1420143
principal_direction(sa.por$azi.PoR)
#> [1] -39.12223
axial_strength(sa.por$azi.PoR)
#> [1] 0.8579857
axial_dispersion(sa.por$azi.PoR)
#> [1] 0.1420143