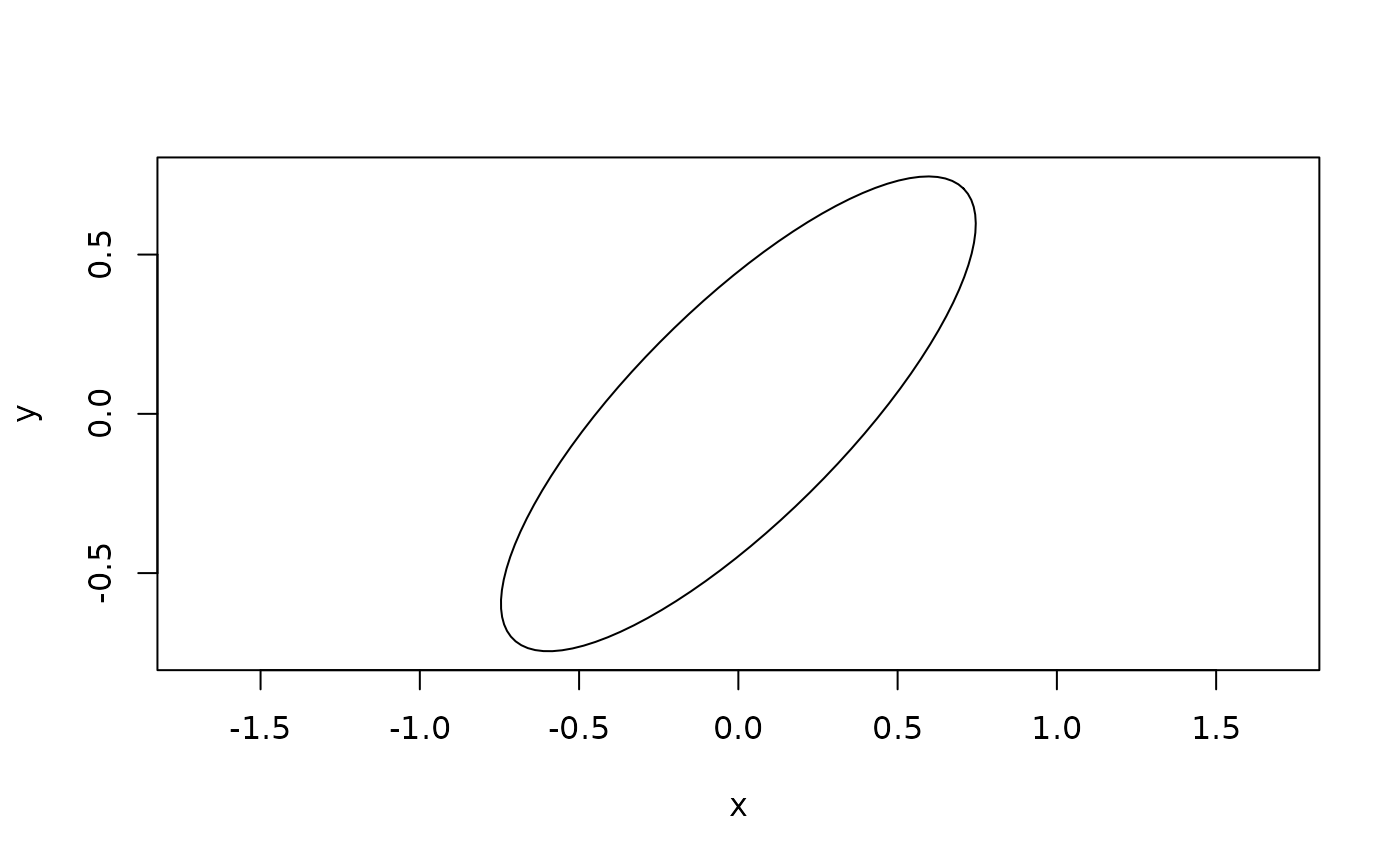
Computes the outline of an ellipse defined by its centre, the length of its
semi-major axis, its aspect ratio, and the azimuth of its long axis. The
coordinate system is assumed to be map-like: x points east and y points
north.
Arguments
- x0, y0
Numeric. Coordinates of the ellipse centre.
- a
Numeric. Length of the semi-major axis (the full long axis is
2 * a).- R
Numeric. Aspect ratio of the ellipse, \(R = a / b\), where
bis the semi-minor axis. Must be \(\ge 1\).- angle
Numeric. Azimuth of the long axis in degrees, measured clockwise from geographic north (i.e. from the positive
yaxis). Because an axis has no direction,angleandangle + 180describe the same ellipse.- n
Integer. Number of vertices used to draw the outline.
Value
A data.frame with n rows and columns x and y. The first and
last vertices are the same, so the outline is closed.